Transitioning from Papers 3 to Bookends: Part 1 - The Why

The Problem

Support for the desktop version of Papers 3, my erstwhile reference management software of choice, was discontinued and sales ceased last November. I have been using some version of Papers on the Mac and iOS for over seven years now, and I have really enjoyed using it on both platforms. The Papers app on iOS was especially useful, with its selective Dropbox-sync and night-reading features. Over the years however, there were many growing annoyances. The lack of significant updates was frustrating, and even when updates were offered, they were largely unable to keep up with operating system advances. Ever since Papers was bought over by ReadCube, I have been worried about the future direction of the software as well as the long-term durability of my reference management system.

Why a reference manager?

Considering the aforementioned problem, a fleeting thought I had was to archive/delete all of my 5000+ PDFs, save a BibTeX file, and give in to the constant connectivity of the attention-economy era: download PDFs from their source whenever I needed it. However, unlike what Spotify does for music (for me), after some thought, I realized that this approach would become troublesome when I’m in the field (>month downtime with no internet, etc.) or traveling. Furthermore, retrieving some hard-to-get PDFs or scans of papers I already would’ve been challenging. I wanted to have access to my papers.

How about simply keeping PDFs somewhere on my iCloud with a fixed naming convention and separately update a BibTeX file with reference information taken from Scholar? I knew I didn’t have to start from scratch because Papers 3 could generate one giant text file with all my references in BibTeX format. This approach was also not entirely appealing. I knew that such a strategy could become unwieldy real quick for an ever-increasing number of papers, especially if I wanted to go inside and edit some references along the way (something that always happens). Also, it would’ve been painful to generate a revised .bib file with a sub-selection of citations for particular projects. Finally, if I ever wanted to use Word or another WYSIWYG editor, citation management would’ve become… a chore. Considering today’s technological umbrella, I don’t think asking for a half-decent reference management software is a tall ask.

What would my ideal reference manager look like?

  • Light, powerful, and not prone to crashing
  • Ability to attach PDFs to references
  • Transparent file handling and archival
  • Ability to handle a LOT of PDFs
  • Automatically “look” through a PDF and crawl the web for its full reference accurately
  • Ability to generate bibliographies or list of references and citations in any format I wanted (preferably customizable)
  • Have a PDF-editing interface where I can annotate or make notes on a paper
  • Ability to batch processes the references of several PDFs
  • Ability to have smart groups and smart search
  • Ability to slice and dice my papers in any way I’d like (e.g., view by journal/authors/keywords, etc.)
  • Syncs with cloud-service of choice (preferably iCloud so I can get out of the Dropbox ecosystem!)
  • Preferably has its own app on iOS via cloud interface
  • An affordable payment plan

Although Papers satisfied some of these constraints, as mentioned above, it had severe limitations, the most frustrating of which was its clunkiness and tendency to crash. Moreover, Papers3 used a “virtual library” system where you could choose how files would be named and stored and eventually viewed through its interface (e.g., Author-Year-Journal), but they were actually stored under a machine-readable format (long string of numbers; DDC3-VD2383248.pdf); I was never a fan of this opaque system.

Bookends

Bookend-Test2.png

Enter Bookends from Sonny Software , a rather unassuming entrant compared to the more well-known platforms (Mendeley, Zotero, etc.) I had first heard of it through the MacPowerUsers forum and then saw some positive things about it on Twitter. Earlier this week, contemplating the long-term home of my PDFs, I decided to take the plunge and see what the fuss was about.

First off, Bookends on Mac costs $60 - it is a one-time buy with updates lasting for two years (at least). The iOS app costs $9.99 as a one-time buy, and then it is another $9.99/year for enabling cloud-sync. To me, this is a very reasonable pricing structure. Bookends does offer a free trial that limits you to 50 references so you can try it out. But first, is it worth it?

Screen Shot 2019-03-14 at 11.18.19 PM.png

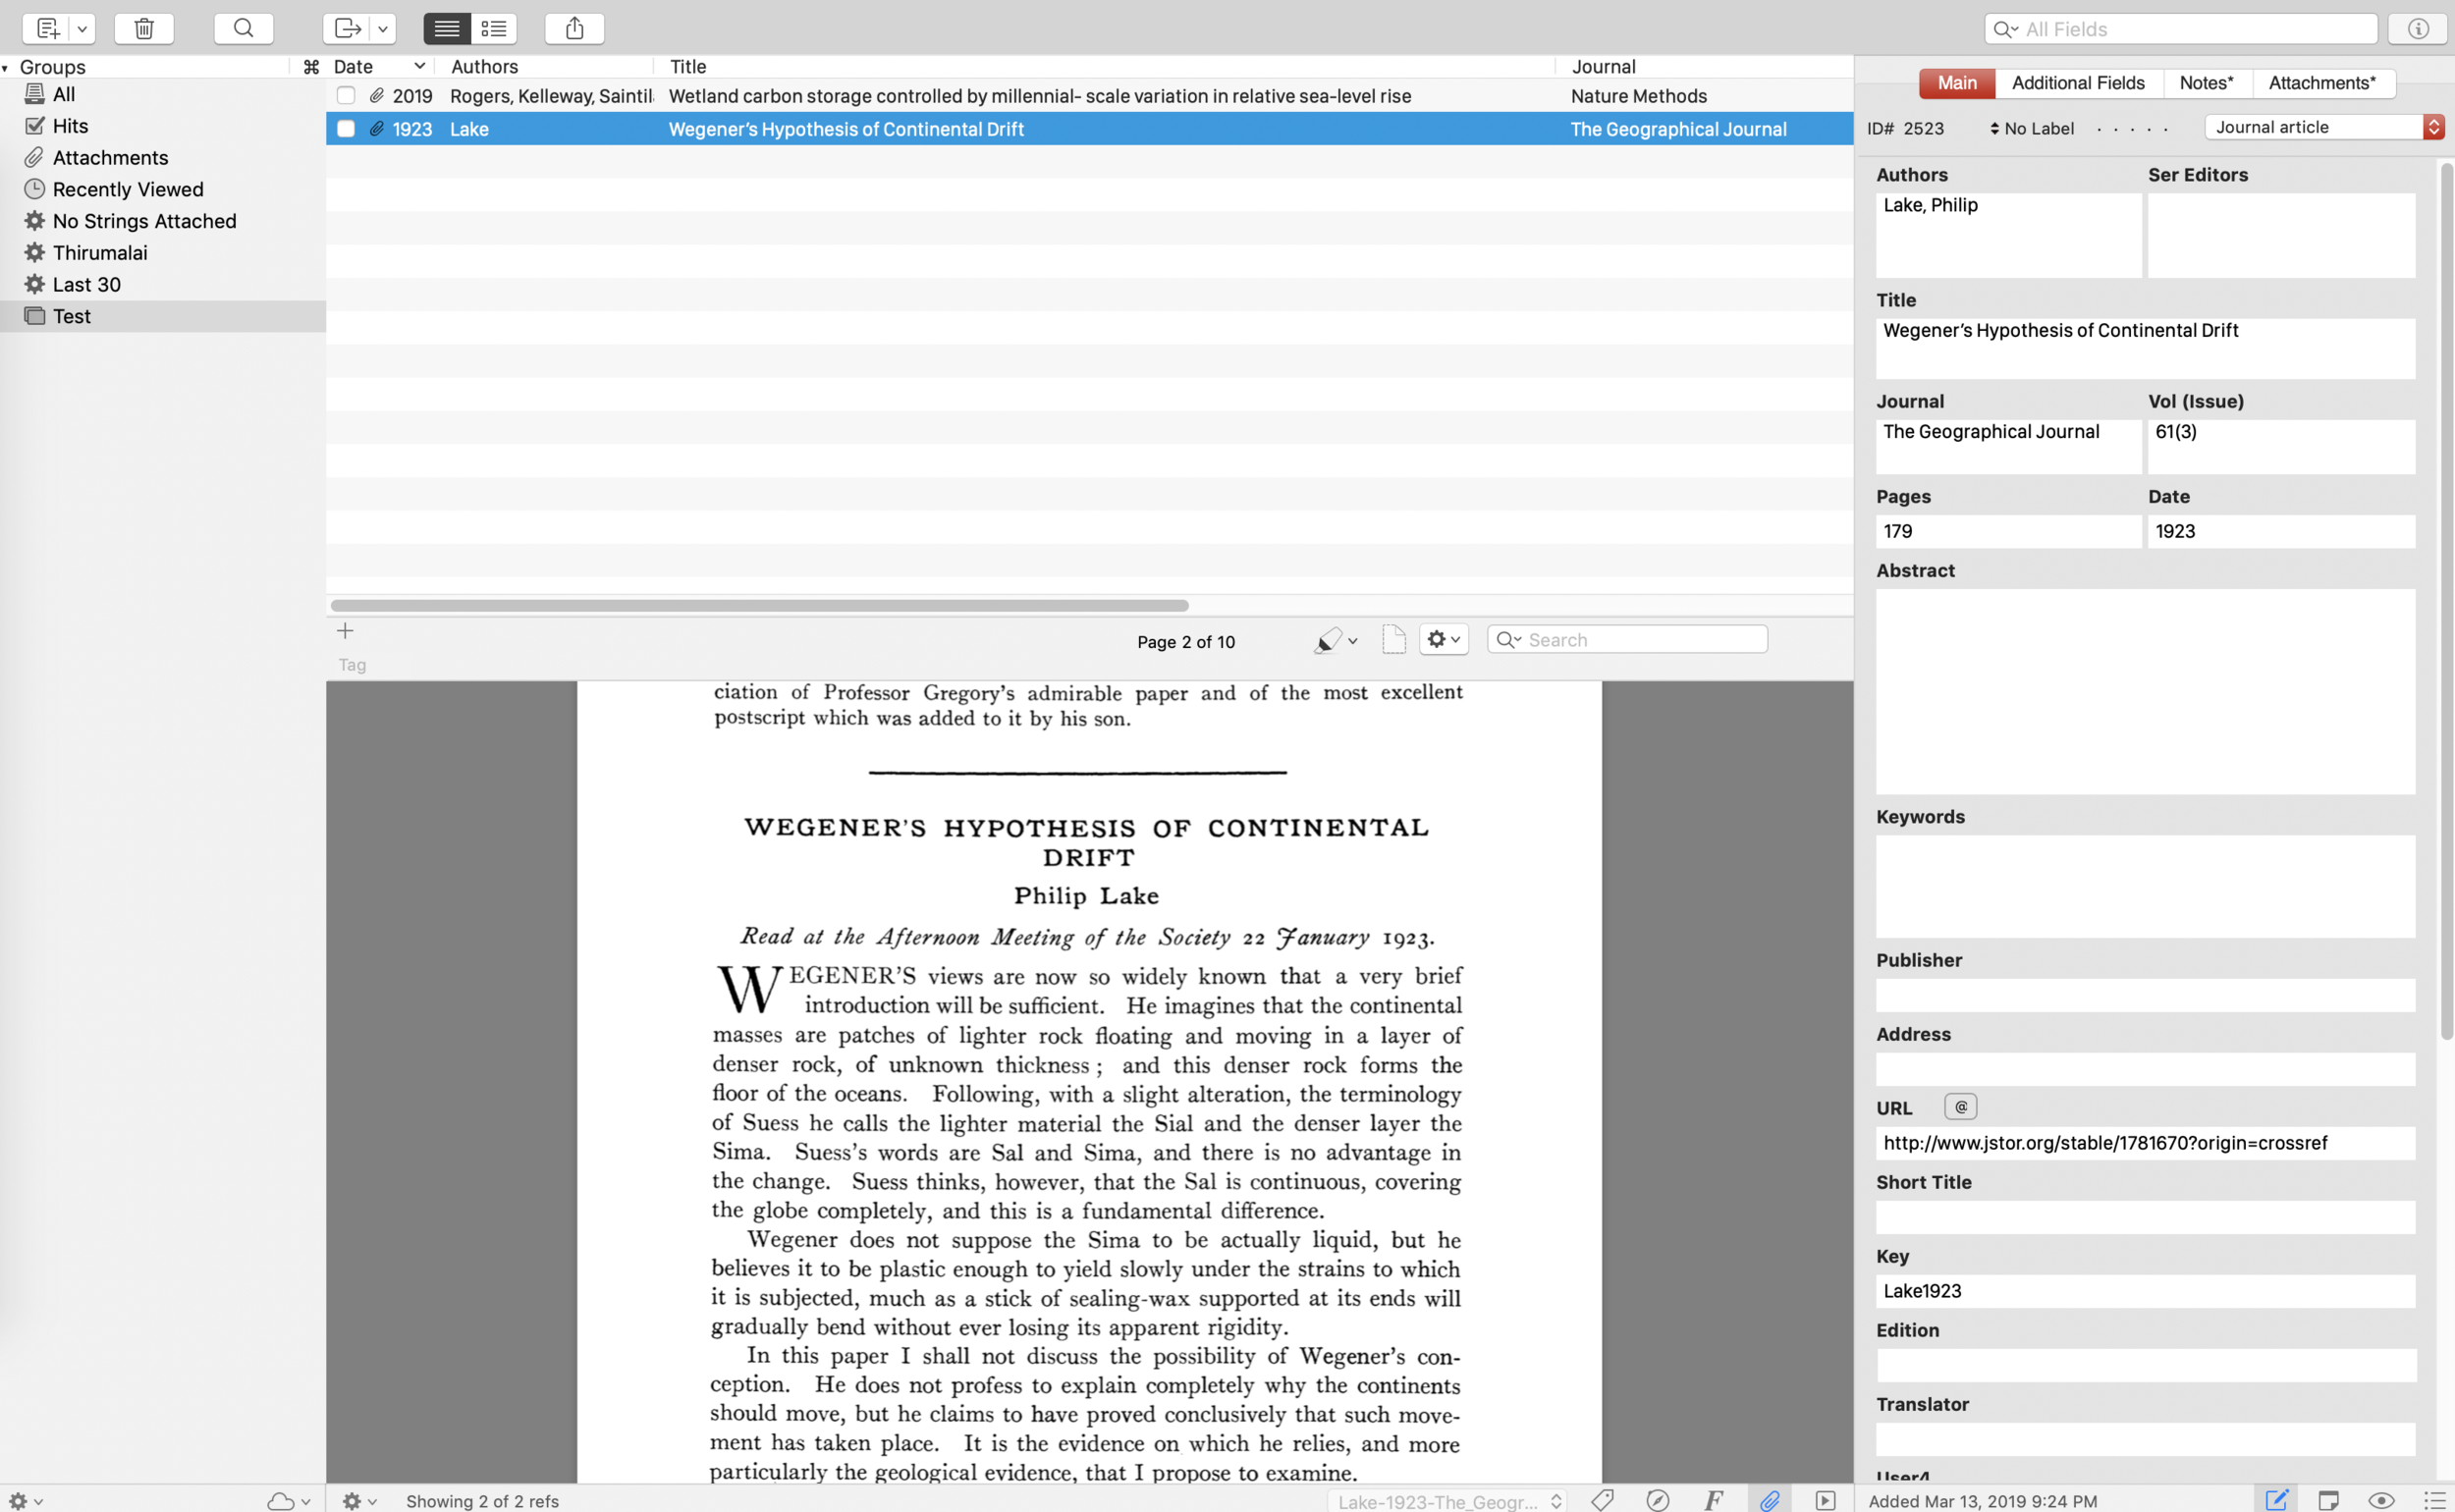
Let me start by saying that Bookends ticks off every bullet point that I mentioned above, and does a LOT more. Starting off, the first thing I did was to investigate how well it can capture a reference from a PDF — this seemed to go very smoothly — Bookends had no problem automatically retrieving information (via JSTOR/Scholar/Web of Life, etc.) for a recently published 2019 article or even one published in 1923.

Ok - so it can perform the basic functionality of a reference manager - what else? Well, the field entries to a reference were quickly editable (refreshingly no lag!), and there were many powerful options for global batch edits. More importantly, the citations’ and reference formats were completely customizable and so was the ability to rename PDF files after importing them. Furthermore, Bookends could sync using iCloud!

Oh my, this seemed rather promising at this point. But - what about iOS? This was where Papers3 excelled. Bookends on iOS did not disappoint. It seemed to be fast, light, and also could fully edit and export citations/references. There was functionality to use customizable search engines (Scholar/Web of Science etc.) for finding articles. Also, you could make notes, highlight, or annotate your PDFs, all of which would sync with the desktop version via iCloud. Furthermore, the app supported split screen view for drag and drop!

With this much potential, I decided to take the plunge. The real test was whether it would be able to handle my 5000+ PDFs and perhaps, even more, pressing: could it port all my existing citations from Papers?

Book Review: Digital Minimalism by Cal Newport

DMin.jpg

Georgetown University’s Cal Newport is back with another book, Digital Minimalism, which extends his outlook on doing more meaningful work in an increasingly distracting world. 

Digital Minimalism is one-part manifesto and one-part popular science. In essence, it is a discourse on the critical disadvantages of constant connectivity and the advantages of being intentional about using today’s technologies. By documenting several studies as well as anecdotal examples of how mobile applications and social media have become deeply interwoven into the fabric of society, Newport makes an excellent case for minimizing the usage of most things digital to (a) break free from screens and (b) regain control of intentionality in communication. Newport contends that finding tools for a problem at hand is a far superior strategy to first gathering tools for hypothetical future issues. This philosophy resonates throughout the book and in particular, hits home concerning today’s smartphone ecosystem, with countless (many unnecessary) mobile applications and innumerable (unconscious) sign-ups for the shiniest new social media platform. 

Newport, unsurprisingly, goes quite deep into providing concrete examples of methods and strategies for assimilating into the digital minimalist’s mindset. Newport showcases read-later apps and blocking apps, but most effectively, demonstrates how social media companies prey on addictive tendencies to develop their platforms (swipe down for refresh = slot machine; bright red notifications, etc.) The book details many suggestions and techniques to offset such tactics and lists the many disadvantages of continually glancing at Twitter or Facebook. Ultimately, Newport asks us to reclaim our time because “our time = their money.” In doing so, he delivers a stark warning about the impact of addictive digital media in today’s attention economy.

At the same time, Newport, who is a computer scientist by profession, also emphasizes that digital minimalism is not an anti-technology movement. The book outlines why careful curation and consideration of apps, as well as their intentional usage, can actually elevate efficiency and efficacy in the workplace (“dumb down your smartphone”). Much of this builds on concepts described in Newport’s earlier book, Deep Work. Concerning the minimization of screens altogether, Digital Minimalism goes a step beyond Deep Work’s ethos of emphasizing “value in boredom” and contains an additional dimension of focus: leisure. Newport pulls together examples of how ‘leisure’ activities, which is easily distanced from the activity of endless scrolling on an app, can contribute to wellbeing and how technology itself can foster such ‘crafty’ activities. 

It’s at this end of the book where I felt that Newport begins to meander and briefly loses sight of the bigger picture. Perhaps unwillingly, the tone morphs into one with a somewhat preachy demeanor and extols the virtues of activities that do not appeal to most readers (e.g., Crossfit) nor extend to their day-to-day realities (e.g., emphasis on handiwork), and importantly aren’t relevant to the message at hand. At times I also felt that the balance between scaremongering and hard facts became fuzzier than at a comfortable level. 

Regardless of these setbacks, Digital Minimalism is an important book on an important topic. Whereas Deep Work was a tour de force on honing intentionality in the workplace, Digital Minimalism is Newport’s effort to extend this perspective to overall wellbeing and personal nourishment. By highlighting some alarming ongoing trends in digital addiction as well as offering tangible solutions to minimize screen use, Digital Minimalism is a compelling read.

[Thanks to Chris Maupin for gifting me a copy of this book!]

The curious case of KL-126: Reconstructing “original measurements” from interpolated data

The Paper

In 2001, Kudrass and colleagues published a paper in Geology documenting a ~70,000 year record of Indian monsoon variability inferred from salinity reconstructions in a Bay of Bengal sediment core, SO93-KL-126. They measured the stable oxygen isotopic composition (δ¹⁸O) in shells of planktic foraminifer G. ruber. The δ¹⁸O of planktic foraminifera varies as a function of sea-surface temperature (SST) and the δ¹⁸O of seawater (δ¹⁸Osw). The latter term can be used as a proxy for salinity (how fresh or how saline past waters in the region were) and finally tied back to rainfall over the subcontinent, provided there is an independent temperature measurement. In this case, Kudrass and others also measured the concentration of alkenones in coeval sediments from core KL-126 as an independent temperature proxy. Thus, with these two measurements, they calculate the two unknowns: temperature and salinity. It is an important study with several implications for how we understand past monsoon changes. The study is ~18 yrs old and has been cited nearly 200 times.

The Problem(s)

One potential hurdle in calculating δ¹⁸Osw from KL-126 is that the δ¹⁸O and alkenone measurements have not been performed at the same time resolution i.e. not all δ¹⁸O values have a co-occurring alkenone-based SST value (the latter is lower-resolution). Such issues are common in paleoceanography due to sampling limitations and availability as well as the demands of intensive geochemical measurements, however, they can be overcome using statistical interpolation. Considering that the degrees of freedom in the SST time series is far less than the δ¹⁸O time series, to ensure that the calculated δ¹⁸Osw (and subsequently, salinity) doesn’t contain artifacts and isn’t aliased, the conservative approach is to interpolate the δ¹⁸O data at the time points where the (lower-resolution) alkenone measurements exist.

This is not the approach taken by Kudrass et al. in their study. Instead, they interpolate the alkenone measurements, with far less number of data points, to the same time steps as the δ¹⁸O measurements prior to calculating δ¹⁸Osw. Thus, the calculated salinity record mirrors the foraminiferal δ¹⁸O measurements because the alkenone SSTs do not vary all that much, and even when they do, are sampled at a much lower resolution.

This leads me to the main point of my blog post: I tried to re-calculate the KL-126 δ¹⁸Osw record, based on their actual number of measured data points - but there is another problem.

The KL-126 data is archived on PANGEA and when I investigated its contents, I found that (1) the alkenone data are archived based on the sample depth (without age) - a minor annoyance, meaning that one has to recalcluate their age model to place the alkenone data over time; but more importantly (2) the archived δ¹⁸O dataset contains >800 data points, sometimes, at time steps of nearly annual resolution! While this might be possible in high-sedimentation regions of the oceans, the Bay of Bengal is not anoxic, and thus, bioturbation and other post-depositional processes (esp. in such a dynamic region offshore the Ganges-Brahmaputra mouth) are bound to integrate (at least) years-to-decades worth of time. Moreover, when we take a closer look at the data (see below) we see multiple points on a monotonically increasing or decreasing tack - clear signs of interpolation - and in this case, a potential example of overfitting the underlying measurements.

Thus, the actual δ¹⁸O measurements from KL-126 have not been archived and instead only an interpolated version of the δ¹⁸O data exists (on PANGEA at least). Many studies have (not wholly correctly) used this interpolated dataset instead (I don’t blame them - it is what’s available!)

The Investigation

Here is a line plot of the archived δ¹⁸O dataset:

Figure 1. A line plot of the G. ruber δ¹⁸O record from KL-126, northern Bay of Bengal, spanning over the past 100 ka. Data is from that archived on PANGEA.

Figure 1. A line plot of the G. ruber δ¹⁸O record from KL-126, northern Bay of Bengal, spanning over the past 100 ka. Data is from that archived on PANGEA.

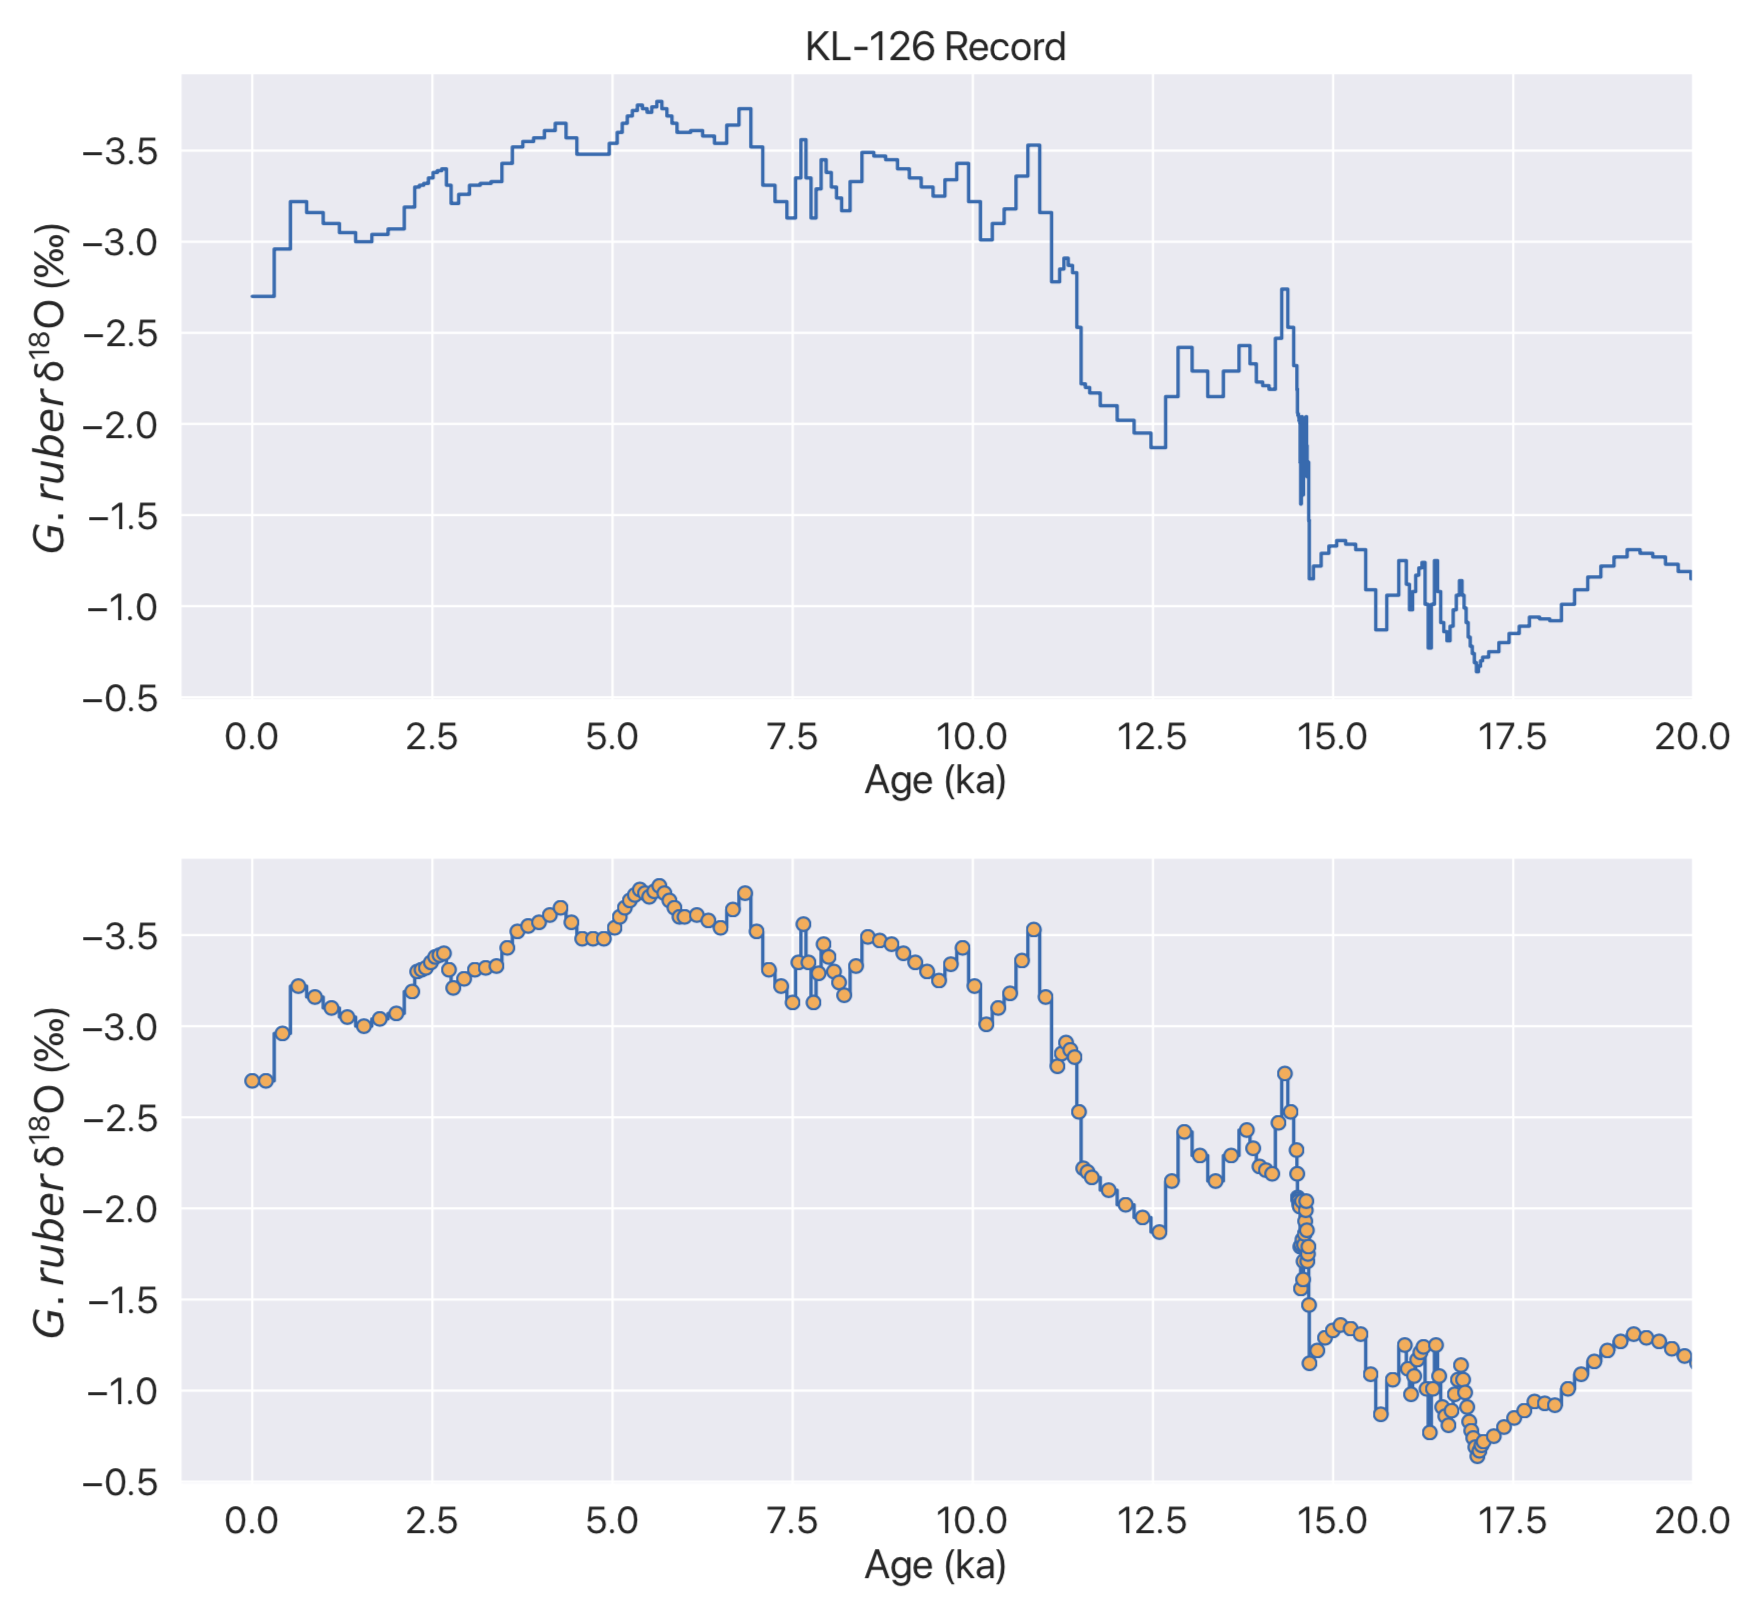
This looks exactly like Fig. 2 in the Geology paper. What’s the problem then? When we use a staircase line for the plot, or use markers, the problem becomes apparent:

Figure 2. Above: A staircase plot of the KL-126 δ¹⁸O record. Below: The same data plotted with markers at each archived data point. Note monotonically increasing or decreasing data points at several times over dataset.

Figure 2. Above: A staircase plot of the KL-126 δ¹⁸O record. Below: The same data plotted with markers at each archived data point. Note monotonically increasing or decreasing data points at several times over dataset.

A closer look, from 0-20 ka:

Figure 3. Same as in Fig. 2 but scaled over the last 20 ka.

Figure 3. Same as in Fig. 2 but scaled over the last 20 ka.

Here is the time resolution of (using the first difference function) each data point with age:

Figure 4. Above: Staircase plot of the KL-126 δ¹⁸O record. Below: Time step (years) between δ¹⁸O data points in the archived record over time. Red dashed line depicts resolution of 50 years.

Figure 4. Above: Staircase plot of the KL-126 δ¹⁸O record. Below: Time step (years) between δ¹⁸O data points in the archived record over time. Red dashed line depicts resolution of 50 years.

The Reconstruction

Now, let’s try to simulate the “original” data. With our eyes (or with, mine at least), we can “see” where they might have measurements, but how can we do this, objectively using data analysis techniques?

One way to approximate the original data is to use the findpeaks function (available in Python’s scipy OR the signal processing toolbox in MATLAB), which can grab local maxima or minima. This will enable us to ignore monotonoically increasing or decreasing interpolated data (by investigating where gradients become zero). Using this function, here are the simulated “original” measurements:

Figure 5. Finding local (note reversed δ¹⁸O scale) maxima (red) and minima (green) in the δ¹⁸O record.

Figure 5. Finding local (note reversed δ¹⁸O scale) maxima (red) and minima (green) in the δ¹⁸O record.

Now, we can group all these ‘peaks’ and approximate the original dataset:

Figure 6. Reconstructing the original δ¹⁸O measurements in the KL-126 record. These data are found below.

Figure 6. Reconstructing the original δ¹⁸O measurements in the KL-126 record. These data are found below.

It’s not perfect, but it’s not bad. I strongly feel that even this approximation is better than using a time series interpolated at a resolution (a lot) higher than the original measurements.

The Goods

If you’ve made it this far down in the blog post, perhaps you’d be interested in the simulated dataset for your own comparison as well as my code so you may check for errors etc. To save you the trouble, I’ve also added the Uk’37 dataset on the same age model so that an actual δ¹⁸O-seawater record over the appropriate time-steps can be calculated.

Here is a Jupyter notebook containing the Python code to replicate the plots and data anlysis from this post, as well as an Excel Spreadsheet containing the final, "reconstructed" dataset. It also contains steps for the alkenone interpolation.