The curious case of KL-126: Reconstructing “original measurements” from interpolated data

The Paper

In 2001, Kudrass and colleagues published a paper in Geology documenting a ~70,000 year record of Indian monsoon variability inferred from salinity reconstructions in a Bay of Bengal sediment core, SO93-KL-126. They measured the stable oxygen isotopic composition (δ¹⁸O) in shells of planktic foraminifer G. ruber. The δ¹⁸O of planktic foraminifera varies as a function of sea-surface temperature (SST) and the δ¹⁸O of seawater (δ¹⁸Osw). The latter term can be used as a proxy for salinity (how fresh or how saline past waters in the region were) and finally tied back to rainfall over the subcontinent, provided there is an independent temperature measurement. In this case, Kudrass and others also measured the concentration of alkenones in coeval sediments from core KL-126 as an independent temperature proxy. Thus, with these two measurements, they calculate the two unknowns: temperature and salinity. It is an important study with several implications for how we understand past monsoon changes. The study is ~18 yrs old and has been cited nearly 200 times.

The Problem(s)

One potential hurdle in calculating δ¹⁸Osw from KL-126 is that the δ¹⁸O and alkenone measurements have not been performed at the same time resolution i.e. not all δ¹⁸O values have a co-occurring alkenone-based SST value (the latter is lower-resolution). Such issues are common in paleoceanography due to sampling limitations and availability as well as the demands of intensive geochemical measurements, however, they can be overcome using statistical interpolation. Considering that the degrees of freedom in the SST time series is far less than the δ¹⁸O time series, to ensure that the calculated δ¹⁸Osw (and subsequently, salinity) doesn’t contain artifacts and isn’t aliased, the conservative approach is to interpolate the δ¹⁸O data at the time points where the (lower-resolution) alkenone measurements exist.

This is not the approach taken by Kudrass et al. in their study. Instead, they interpolate the alkenone measurements, with far less number of data points, to the same time steps as the δ¹⁸O measurements prior to calculating δ¹⁸Osw. Thus, the calculated salinity record mirrors the foraminiferal δ¹⁸O measurements because the alkenone SSTs do not vary all that much, and even when they do, are sampled at a much lower resolution.

This leads me to the main point of my blog post: I tried to re-calculate the KL-126 δ¹⁸Osw record, based on their actual number of measured data points - but there is another problem.

The KL-126 data is archived on PANGEA and when I investigated its contents, I found that (1) the alkenone data are archived based on the sample depth (without age) - a minor annoyance, meaning that one has to recalcluate their age model to place the alkenone data over time; but more importantly (2) the archived δ¹⁸O dataset contains >800 data points, sometimes, at time steps of nearly annual resolution! While this might be possible in high-sedimentation regions of the oceans, the Bay of Bengal is not anoxic, and thus, bioturbation and other post-depositional processes (esp. in such a dynamic region offshore the Ganges-Brahmaputra mouth) are bound to integrate (at least) years-to-decades worth of time. Moreover, when we take a closer look at the data (see below) we see multiple points on a monotonically increasing or decreasing tack - clear signs of interpolation - and in this case, a potential example of overfitting the underlying measurements.

Thus, the actual δ¹⁸O measurements from KL-126 have not been archived and instead only an interpolated version of the δ¹⁸O data exists (on PANGEA at least). Many studies have (not wholly correctly) used this interpolated dataset instead (I don’t blame them - it is what’s available!)

The Investigation

Here is a line plot of the archived δ¹⁸O dataset:

Figure 1. A line plot of the G. ruber δ¹⁸O record from KL-126, northern Bay of Bengal, spanning over the past 100 ka. Data is from that archived on PANGEA.

Figure 1. A line plot of the G. ruber δ¹⁸O record from KL-126, northern Bay of Bengal, spanning over the past 100 ka. Data is from that archived on PANGEA.

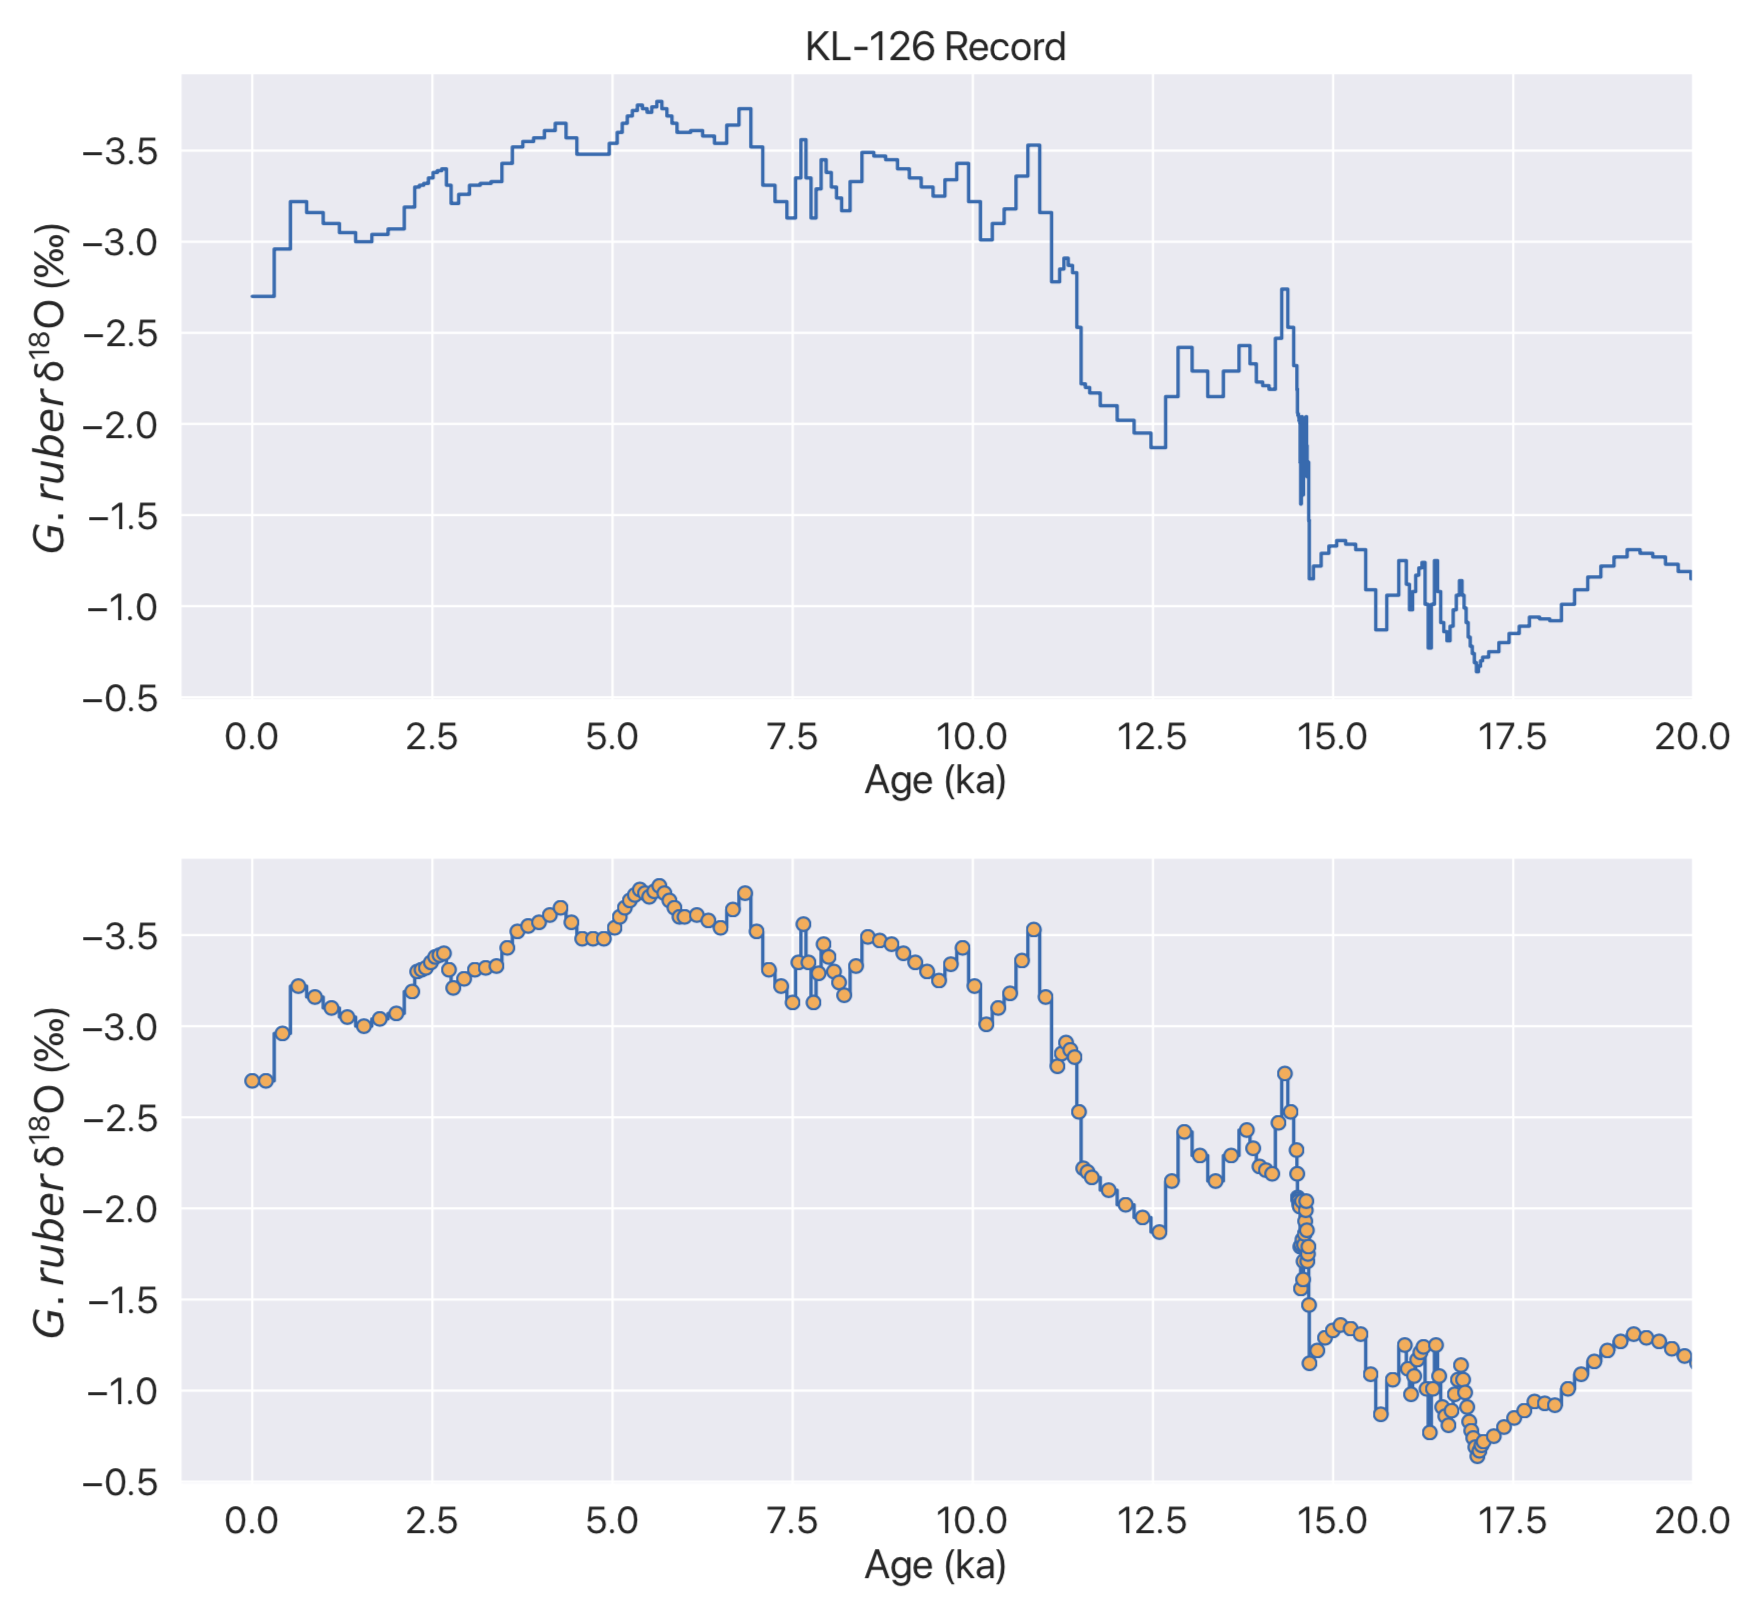
This looks exactly like Fig. 2 in the Geology paper. What’s the problem then? When we use a staircase line for the plot, or use markers, the problem becomes apparent:

Figure 2. Above: A staircase plot of the KL-126 δ¹⁸O record. Below: The same data plotted with markers at each archived data point. Note monotonically increasing or decreasing data points at several times over dataset.

Figure 2. Above: A staircase plot of the KL-126 δ¹⁸O record. Below: The same data plotted with markers at each archived data point. Note monotonically increasing or decreasing data points at several times over dataset.

A closer look, from 0-20 ka:

Figure 3. Same as in Fig. 2 but scaled over the last 20 ka.

Figure 3. Same as in Fig. 2 but scaled over the last 20 ka.

Here is the time resolution of (using the first difference function) each data point with age:

Figure 4. Above: Staircase plot of the KL-126 δ¹⁸O record. Below: Time step (years) between δ¹⁸O data points in the archived record over time. Red dashed line depicts resolution of 50 years.

Figure 4. Above: Staircase plot of the KL-126 δ¹⁸O record. Below: Time step (years) between δ¹⁸O data points in the archived record over time. Red dashed line depicts resolution of 50 years.

The Reconstruction

Now, let’s try to simulate the “original” data. With our eyes (or with, mine at least), we can “see” where they might have measurements, but how can we do this, objectively using data analysis techniques?

One way to approximate the original data is to use the findpeaks function (available in Python’s scipy OR the signal processing toolbox in MATLAB), which can grab local maxima or minima. This will enable us to ignore monotonoically increasing or decreasing interpolated data (by investigating where gradients become zero). Using this function, here are the simulated “original” measurements:

Figure 5. Finding local (note reversed δ¹⁸O scale) maxima (red) and minima (green) in the δ¹⁸O record.

Figure 5. Finding local (note reversed δ¹⁸O scale) maxima (red) and minima (green) in the δ¹⁸O record.

Now, we can group all these ‘peaks’ and approximate the original dataset:

Figure 6. Reconstructing the original δ¹⁸O measurements in the KL-126 record. These data are found below.

Figure 6. Reconstructing the original δ¹⁸O measurements in the KL-126 record. These data are found below.

It’s not perfect, but it’s not bad. I strongly feel that even this approximation is better than using a time series interpolated at a resolution (a lot) higher than the original measurements.

The Goods

If you’ve made it this far down in the blog post, perhaps you’d be interested in the simulated dataset for your own comparison as well as my code so you may check for errors etc. To save you the trouble, I’ve also added the Uk’37 dataset on the same age model so that an actual δ¹⁸O-seawater record over the appropriate time-steps can be calculated.

Here is a Jupyter notebook containing the Python code to replicate the plots and data anlysis from this post, as well as an Excel Spreadsheet containing the final, "reconstructed" dataset. It also contains steps for the alkenone interpolation.

LaTex on iOS? Texpad is one way to go!

LaTeX

If you’re not familiar with LaTeX or haven’t used it yet: don’t panic; chances are, you might be more productive and efficient without it! According to empirical research by Knauf & Nejasmic in 2014, LaTeX users were especially susceptible to grammatical and orthographical errors. Although (importantly, I feel), the study also found that LaTeX users reported enjoying their respective software editors a lot more than their counterpart WYSIWYG (or What you see is what you get editors) users. 

Essentially, LaTeX is a plain text writing interface which formats a document you are preparing in as simple or as complex a structure as you’d want, using relatively simple syntax. It's easy to get started with LaTeX (this is a great resource) and there are plenty of editors available that can show you real-time previews of your document. Regardless of average productivity, there are some reasons why I prefer writing academic text in LaTeX and why it works for me:

  • It provides a distraction-free environment for academic writing: when I open up my LaTeX editor, I know it’s go-time!

  • The structure of formatting equations, symbols (such as δ¹⁸O for example), tables, and figures is intuitive and simple. This can be particularly boosted with the use of text expanding software (such as aText) or Apple Scripts.

  • Academic journals usually share LaTeX templates formatted according to their specifications. This makes reformatting into another journal’s format a breeze.

  • BibTeX makes the insertion of citations and formatting of references effortless. My article management system, Papers3, has an easy-to-use BibTeX record export for any papers I might need to cite for a particular manuscript or proposal.

  • It’s free and open source!

Texpad

Although LaTeX itself is a free and open source software, there are several pay-to-use editors with varying degrees of utility depending on the purpose and user. I’ve tried out quite a few editors to varying degrees of (personal) success. Currently, the one that works best for me is Texpad. First off, Texpad is only compatible with Apple and is not particularly inexpensive: the Mac version is $25 and the iOS version is $15. This has proved worth it for me though, especially since I have configured the iOS version to sync via iCloud. This means I can simply sit on my couch with the iPad and continue writing a manuscript where I left off on the MacBook book in the office! With the advent of iOS 11, it has never been easier to move complex tasks usually suited for the laptop over to the iPad, and Texpad brings this same functionality to LaTeX. The nerd in me delights at the prospect of taking a piece of glass wherever I want and still type an academic manuscript.

Advantages of Texpad:

  • The editor is light yet powerful.

  • The editor is enabled with a spellchecker! 

  • The editor can autocomplete citations and other commands.

  • It “knows” your code with effective highlighting and parsing, as well as recognizing bookmarks and structures in your document.

  • The design and UI is clean, minimal, highly customizable (themes and fonts!), and helps me focus.

  • It is also compatible with Markdown.

  • There is an iOS version with a local, offline typesetter that actually works!

Setting up Texpad on iOS with iCloud

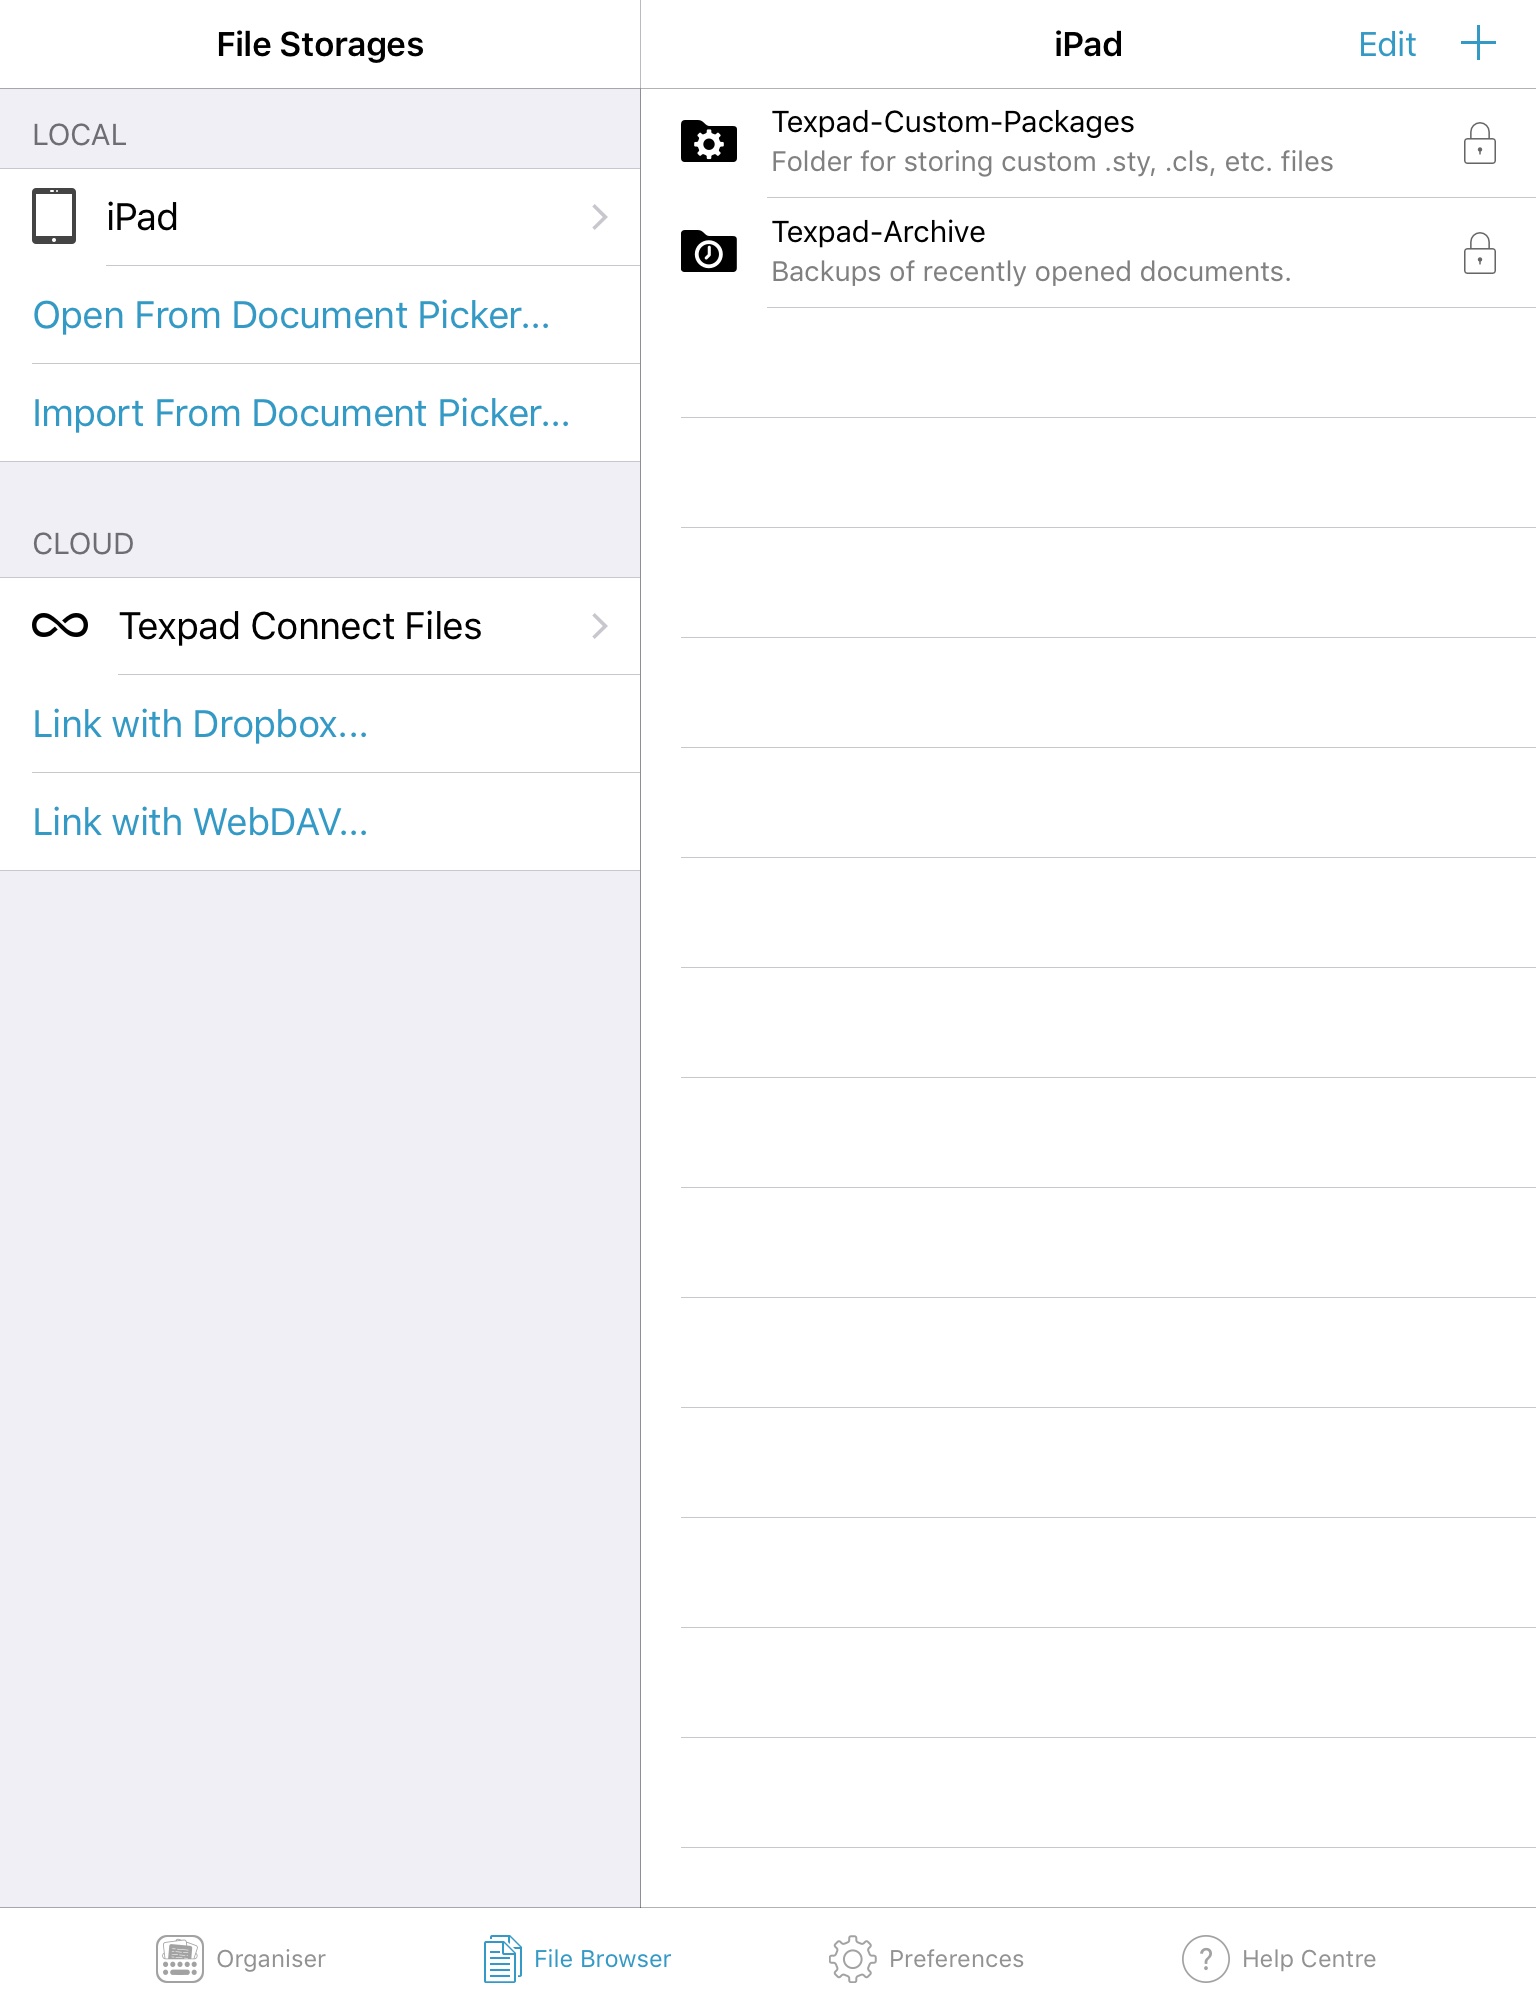
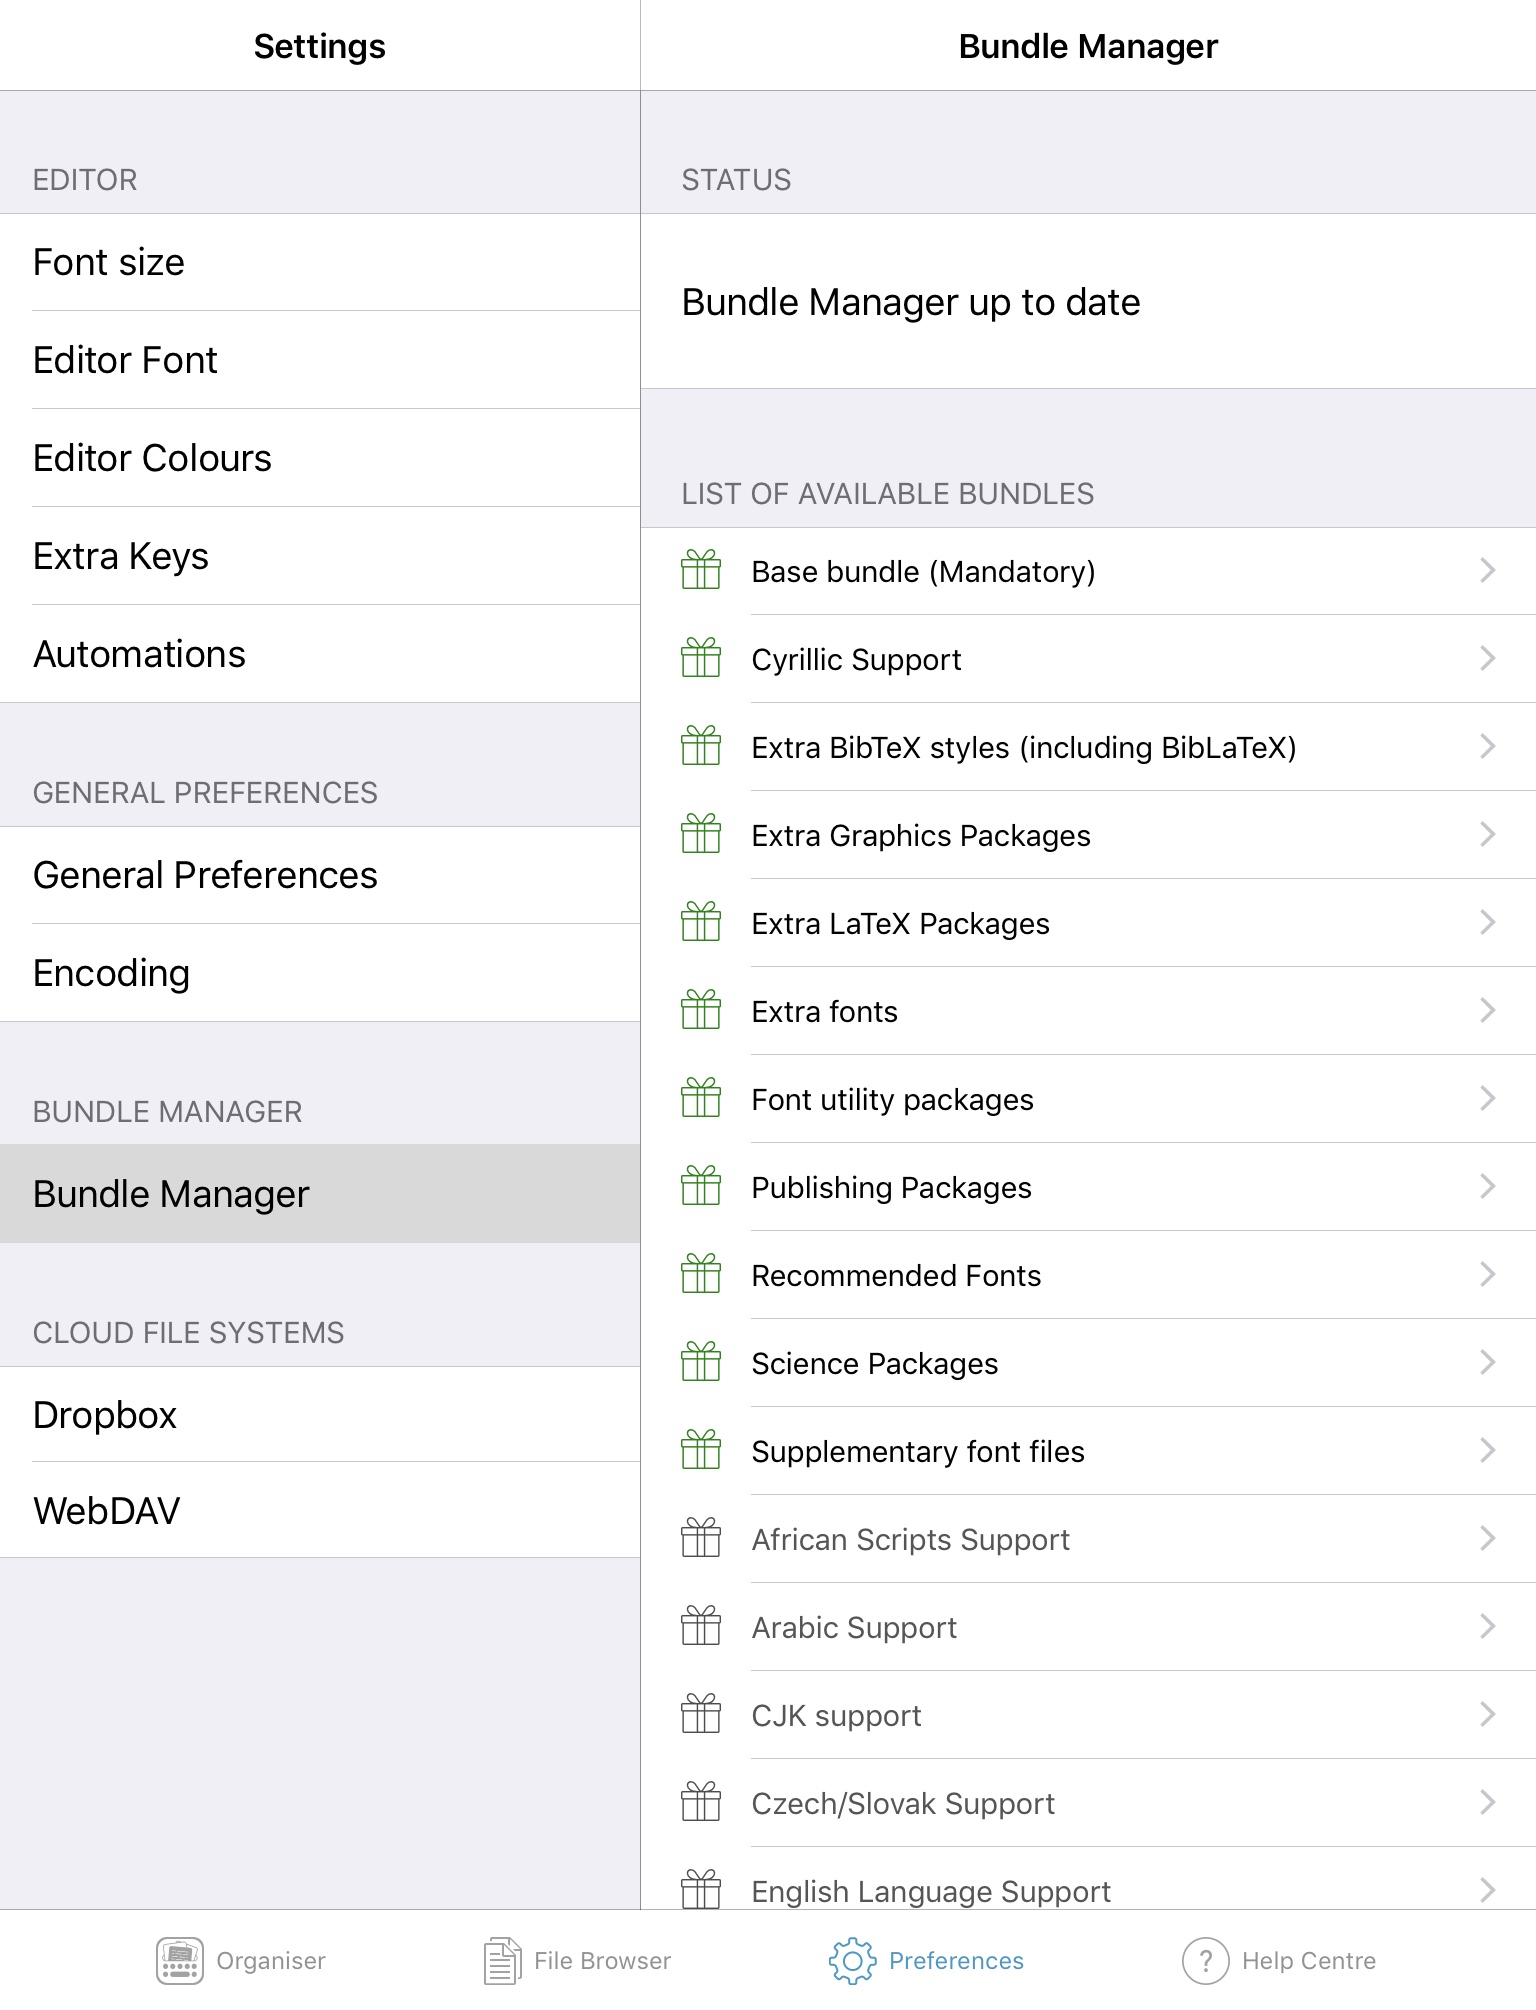
Texpad on the iOS has a file browser that is compatible with the new Files app and also has access to Dropbox and WebDAV. Texpad has its own cloud platform called Connect for syncing projects, but I found this to be really buggy and incapable of handling journal-based projects (even the AGU template for example) on the iPad (lots of crashing and heartbreak!) Next, I tried the Dropbox sync (I am a Dropbox user) but even this proved to be somewhat buggy. Finally, I went back to the Files app and tried to sync my projects with iCloud: this was a resounding success, regardless of project size or complexity! Here’s how I set it up:

  1. Download the Texpad iOS app.
  2. On your MacBook, create an iCloud-synced folder entitled ‘Texpad’ (or some variant) and make sure you save your LaTeX project here on the Mac-version of Texpad, including the .bib, .sty, and .bst files for your journal formatted manuscript.
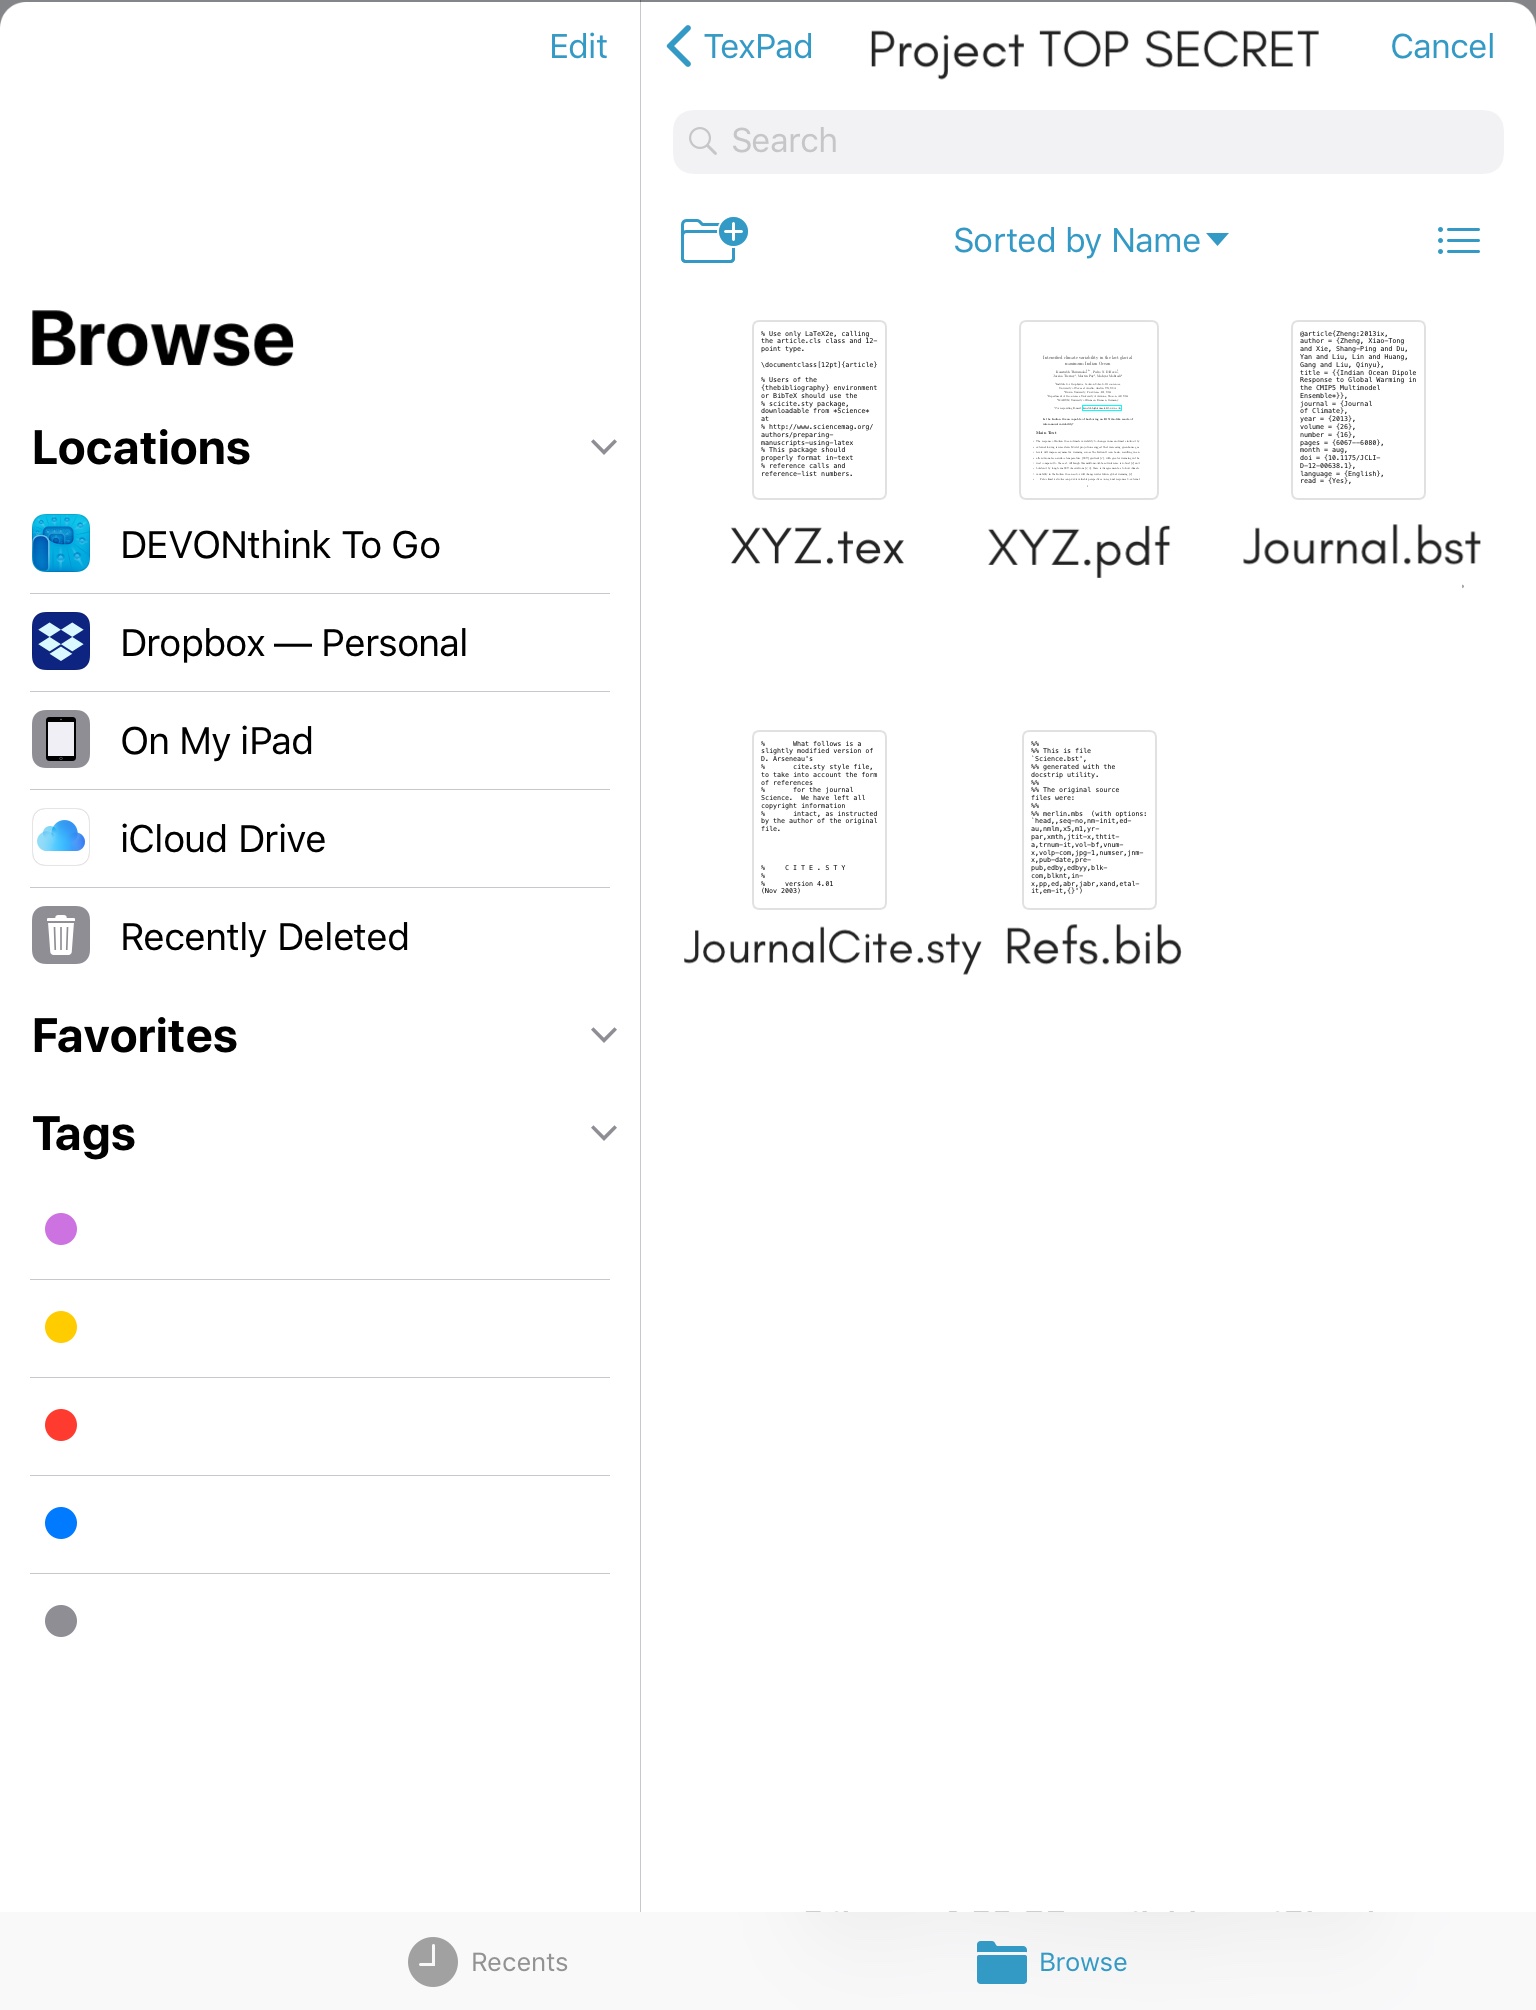
  3. In the iOS app, under File Browser, click on Open From Document Picker under ‘Local’. (Note Open versus Import will depend on what type of versioning history you’d like to set for your project).
  4. This will open the Files app, and once you navigate over to your iCloud Drive, you will see your saved projects under the Texpad folder you created.
  5. Open the .tex file.
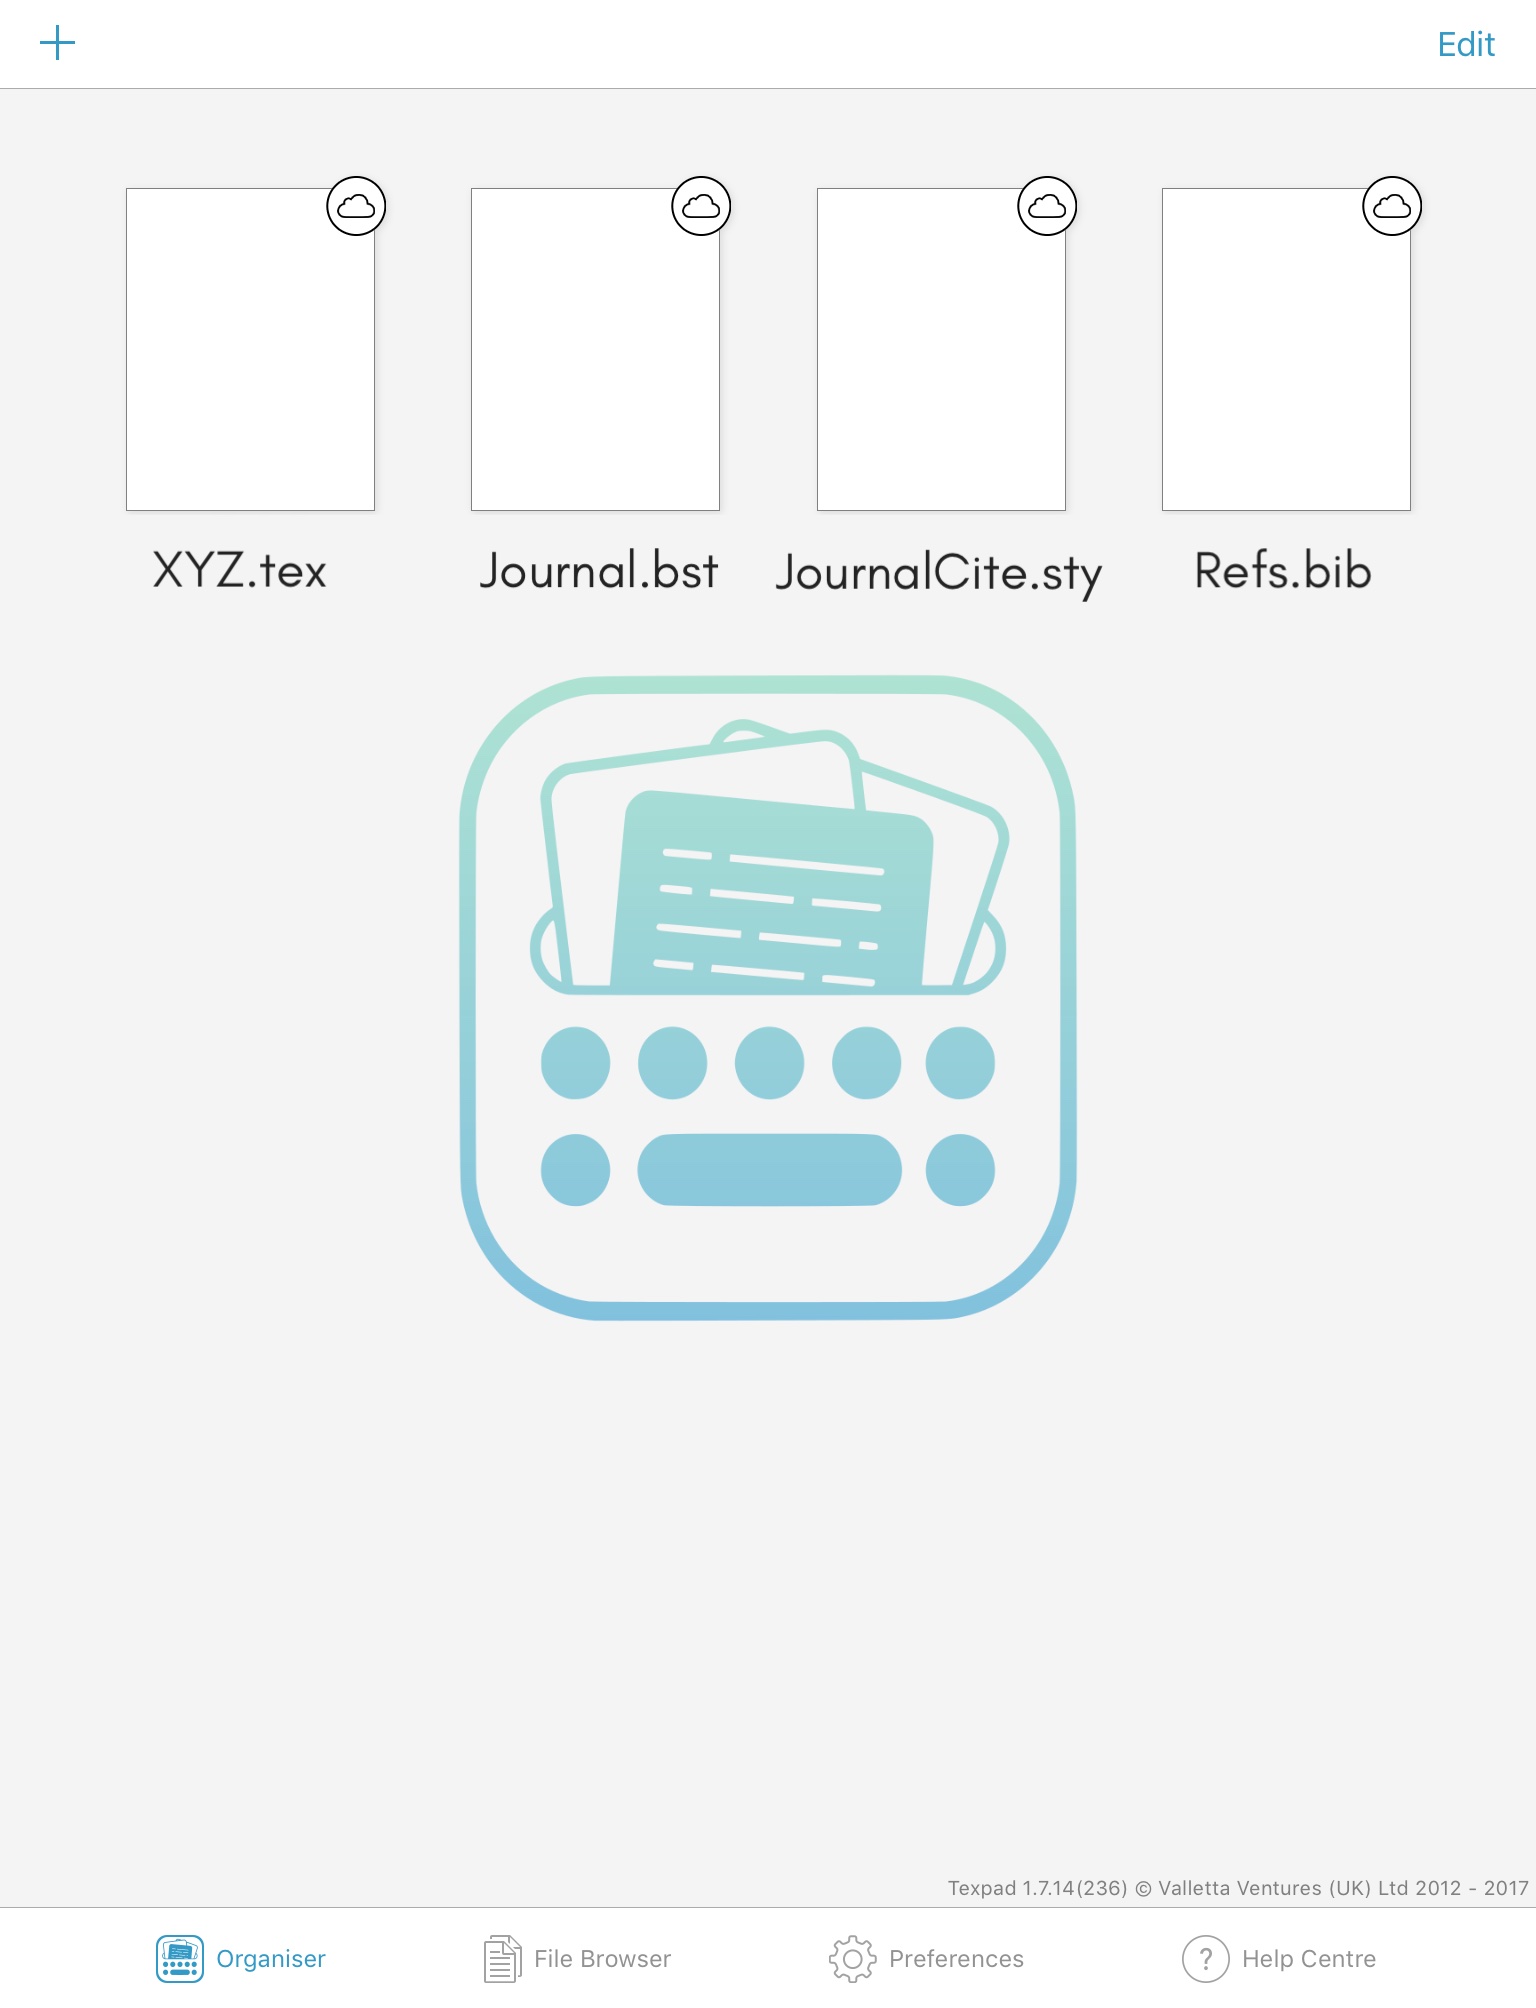
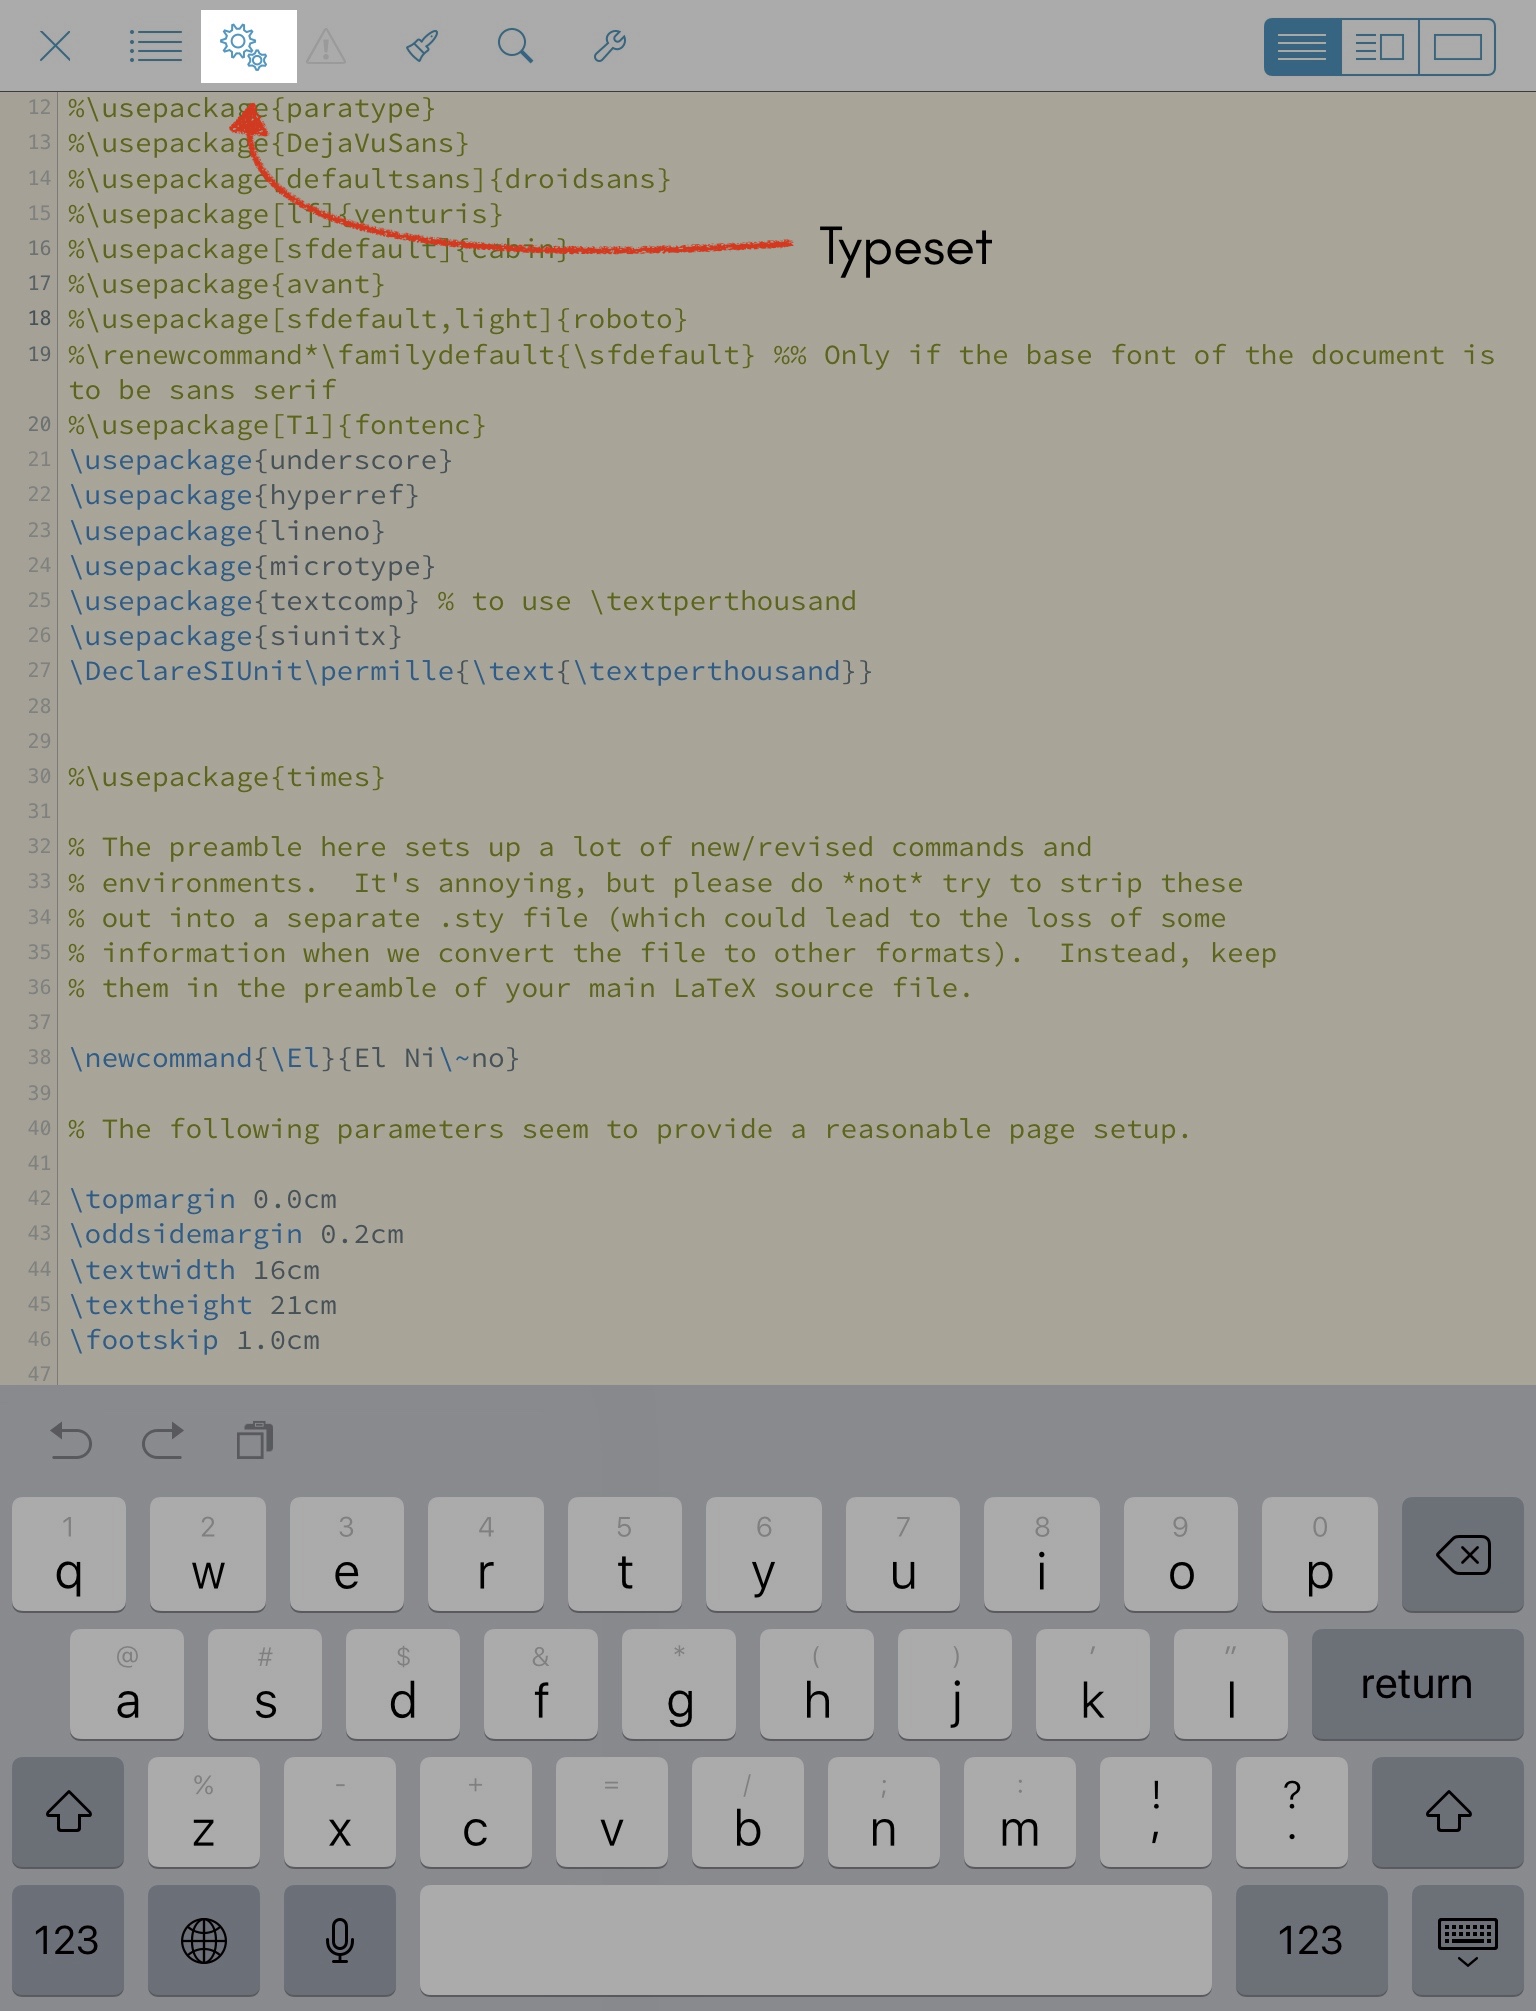
  6. Before hitting ‘Typeset’ (I know it’s tempting!), go back to the File Browser, and open all the other files (BibTeX etc.) related to your project. This will ensure that these files are accessible for typesetting on your iOS device.
  7. Last step before typesetting: make sure that you download all the bundles that your LaTeX typesetter needs including all those fancy fonts
  8. Typeset and enjoy!

Review: Note-Taking Apps on the iPad

I've been a little late to the party after having acquired an iPad (I'm using an iPad Mini 4), but I've finally delved a little deeper into (handwriting) note-taking apps. Although I am a big proponent of putting pen on paper, taking digital notes to boost academic productivity makes a lot of sense for many reasons including a lighter load to carry, optical character recognition, easy digital access to your favorite file management system, quick incorporation of media into your notes etc. Currently, I still prefer my fountain pen and paper for brainstorming and refining ideas, but over the last few weeks, I’ve found that note-taking apps have been very useful in navigating the day-to-day activities of academia including meetings, seminars, and Skype sessions.

When it comes to handwriting apps on the iPad, in my opinion, a stylus is essential. I haven't caved in yet for an Apple pencil but I have found a really good stylus which I would recommend (and is much cheaper!) A stylus is especially useful because most of these apps have a magnifier feature which makes it easier to write neatly and organize your notes. I've tried out three different apps and this post details the pros and cons according to my experience.

The apps I've looked into:

  1. Penultimate (Free)
  2. Notability ($9.99)
  3. GoodNotes ($7.99)

Penultimate

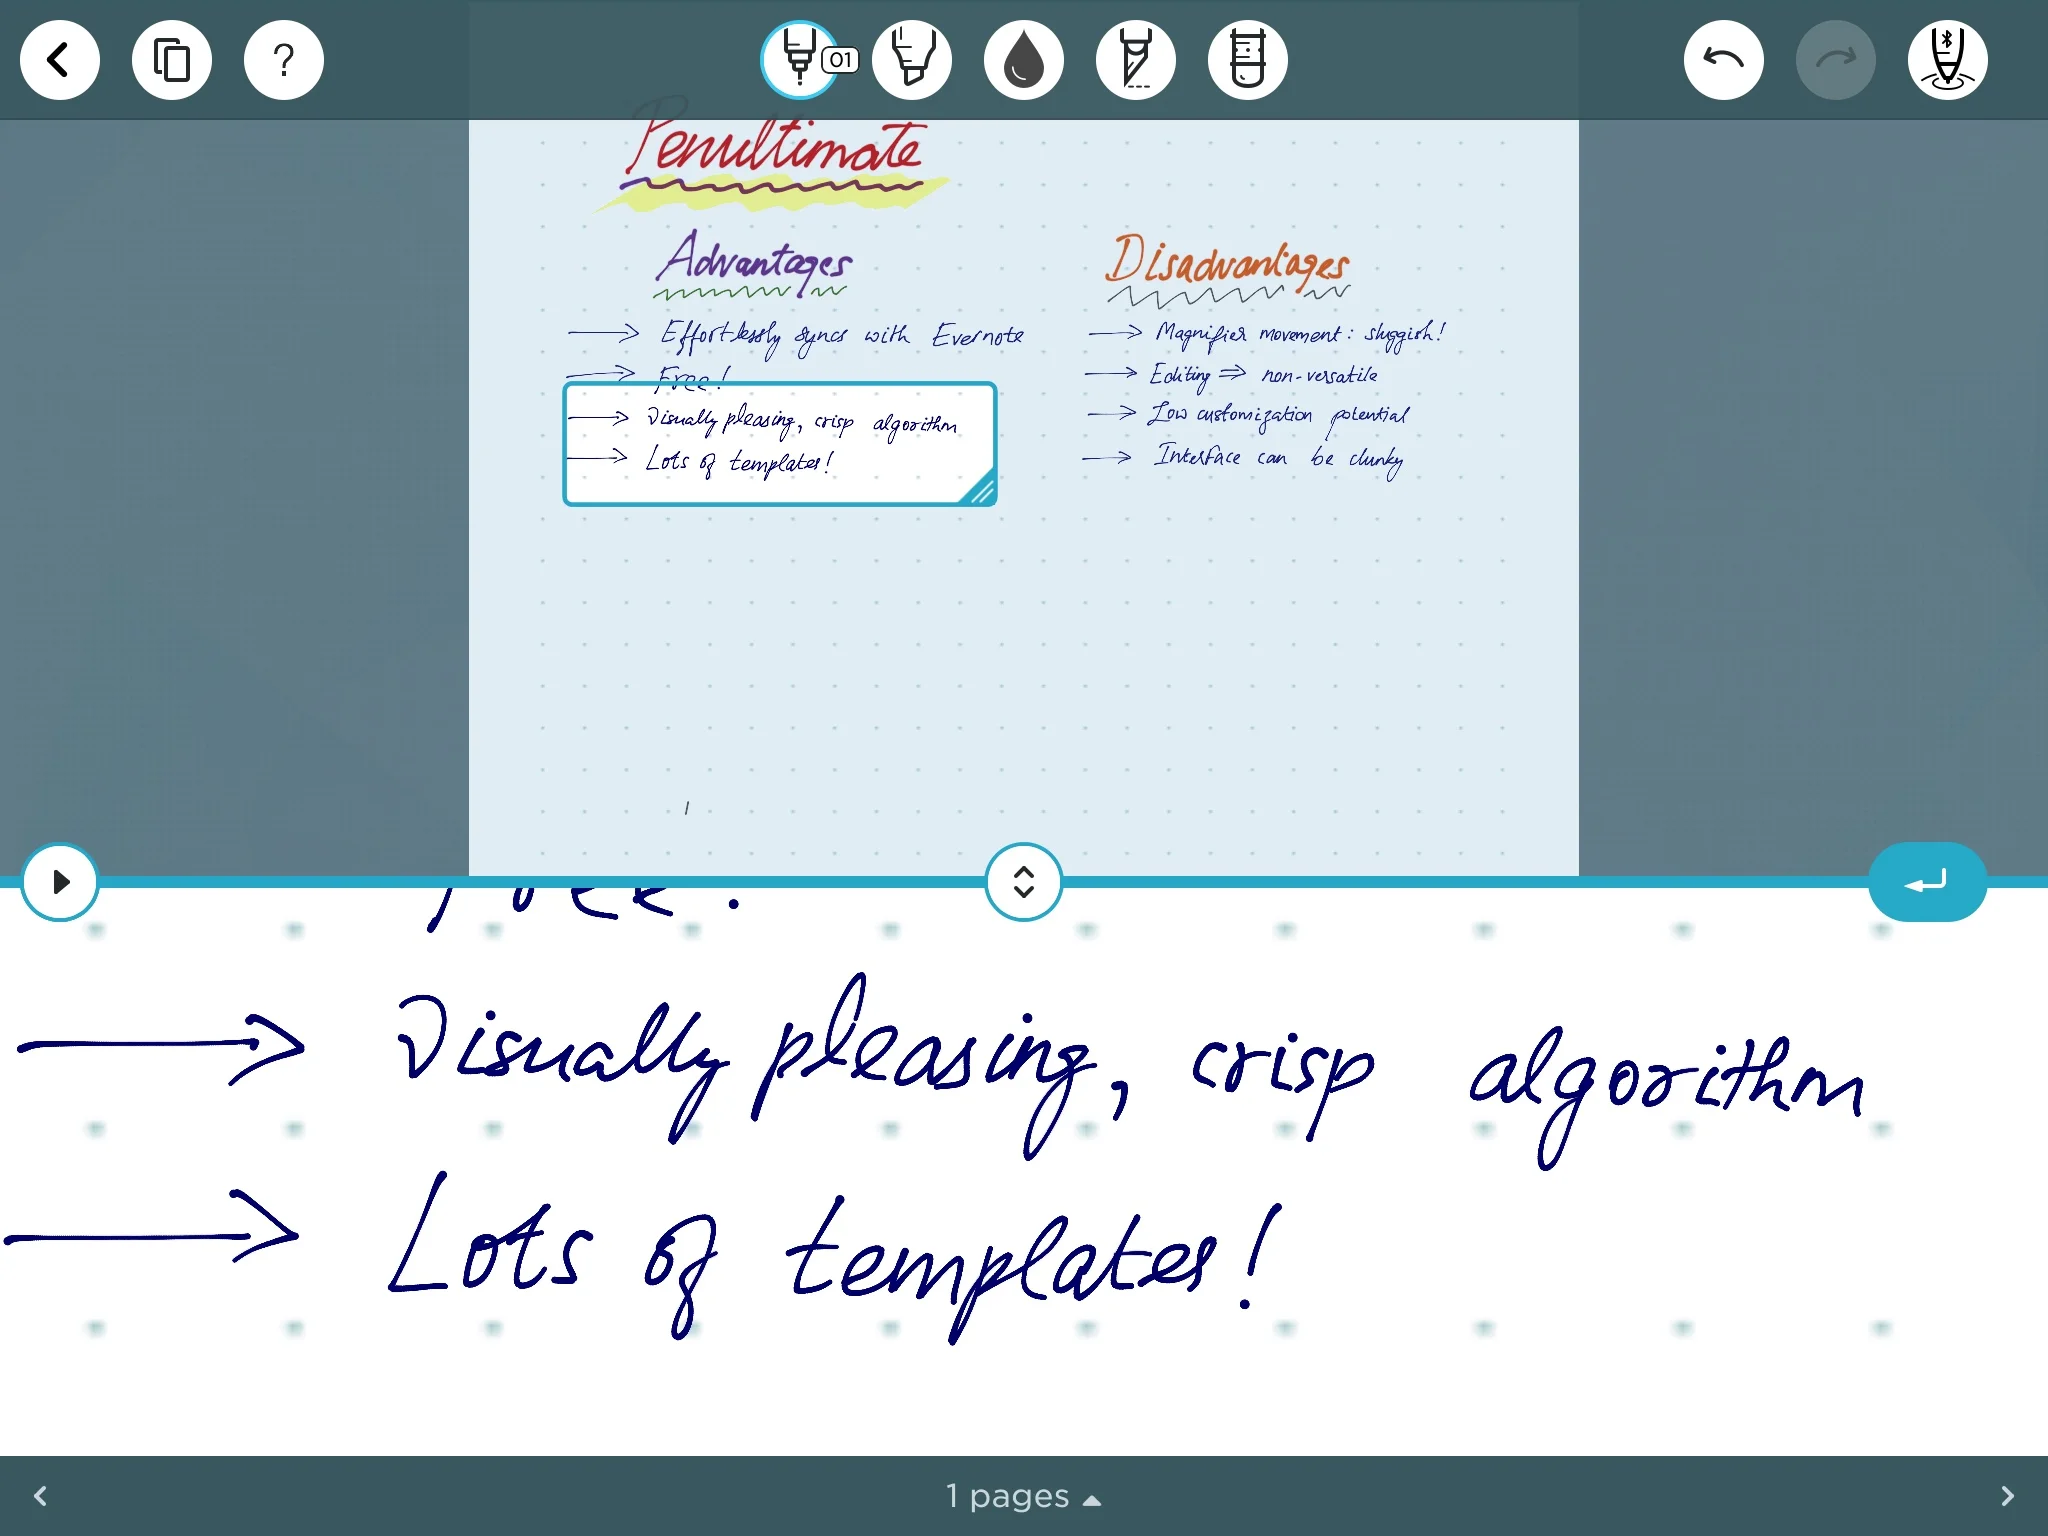
An example screenshot from Penultimate.

An example screenshot from Penultimate.

Pros

  • It's FREE!
  • Seamless sync with Evernote
  • Great variety and breadth of templates to choose
  • Colors and lines are visually pleasing
  • Handwriting algorithm renders a rather crisp display which is aesthetically pleasing

Cons

  • No Optical Character Recognition (OCR) feature
  • The "auto-scroll" option while on magnification is really clunky
  • Difficult to organize and subcategorize notes
  • No multi-tab feature and overall basic customization
  • Cannot set different margins for return on magnifier
  • No sound recording option
  • Not intuitive to incorporate images/media
  • Cannot edit the notes via freehand option on Evernote

Verdict: Penultimate was the first app I tried out because it was free and synced with Evernote (a file management software I use heavily). It is a good app to get your feet wet but with several missing features that make note-taking apps work for academic productivity, such as OCR, organization utility, and smooth movement on magnification, it doesn't make the final cut. 


Notability

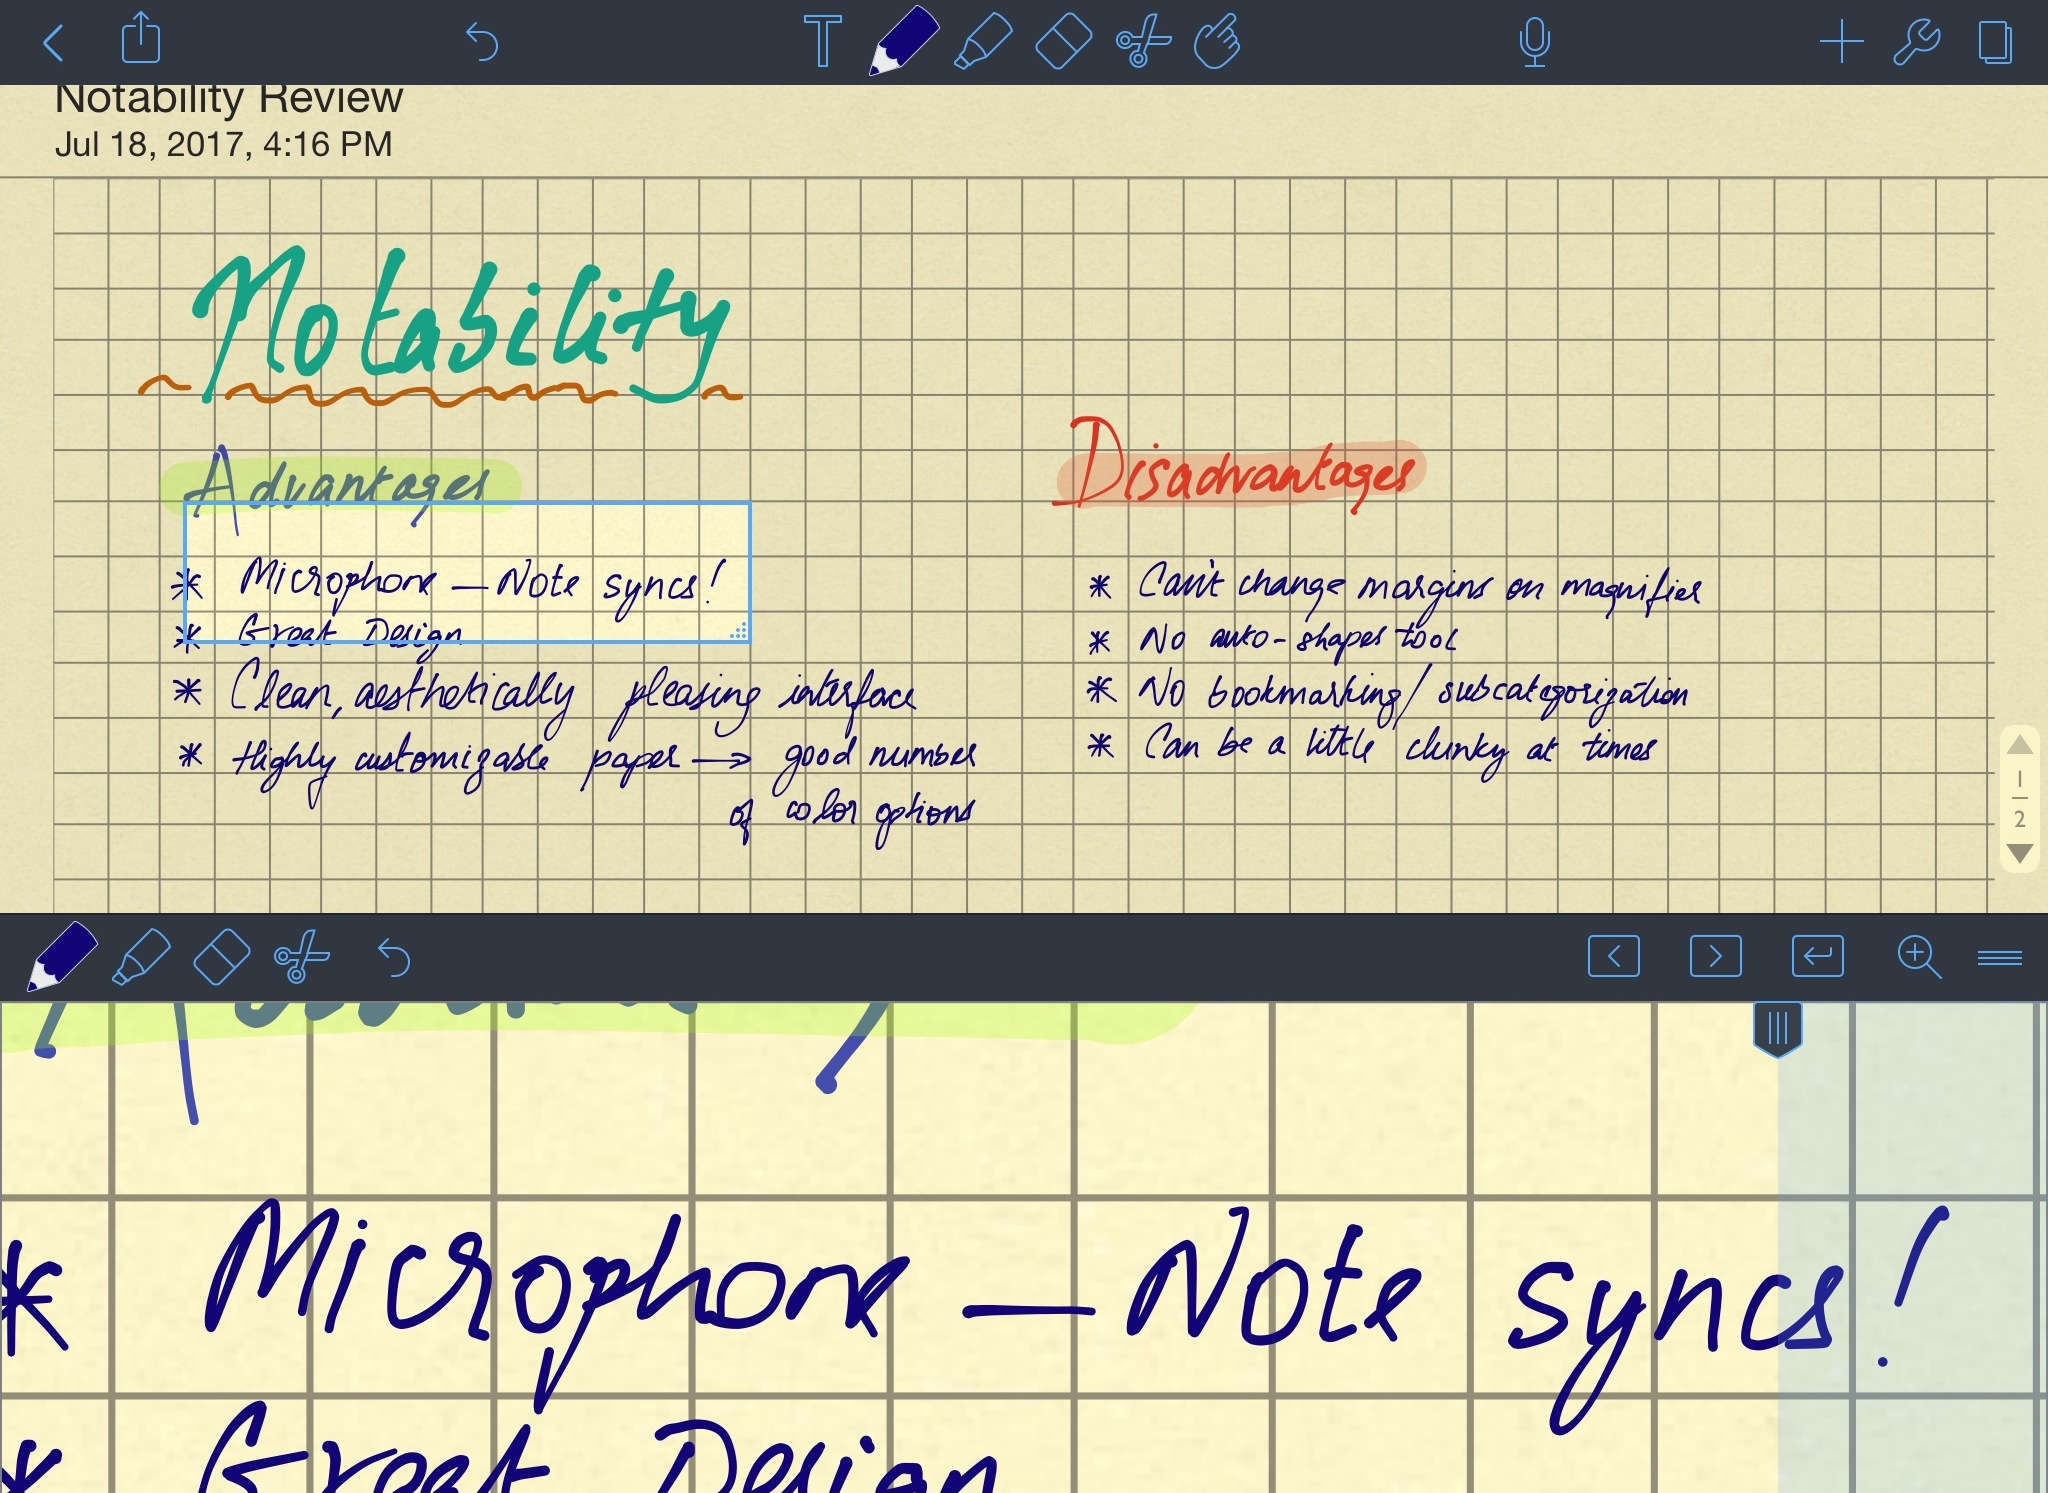
An example screenshot from Notability.

An example screenshot from Notability.

Pros

  • You can record notes with your microphone! Furthermore, you can playback the audio with an in-situ note-taking sync!
  • The design is clean, minimal, and effective
  • Highly customizable backgrounds
  • The handwriting algorithm is really smooth

Cons

  • It's expensive as far as iPad apps go...
  • No OCR feature
  • No auto-shape tool which can be very useful for annotation and organization
  • The margins on magnifier can't be changed (useful for column-type note writing)
  • Subcategorization and bookmarking features aren't available
  • Not a lot of diversity in templates

Verdict: Notability is a great app on the whole, with its design and interface being truly top-notch. The real winner for Notability is its note-sync-enabled microphone option and if this is something that appeals to you, it' really the way to go. The dealbreaker for me was the lack of OCR, where you can select your handwritten text and convert it into characters. 


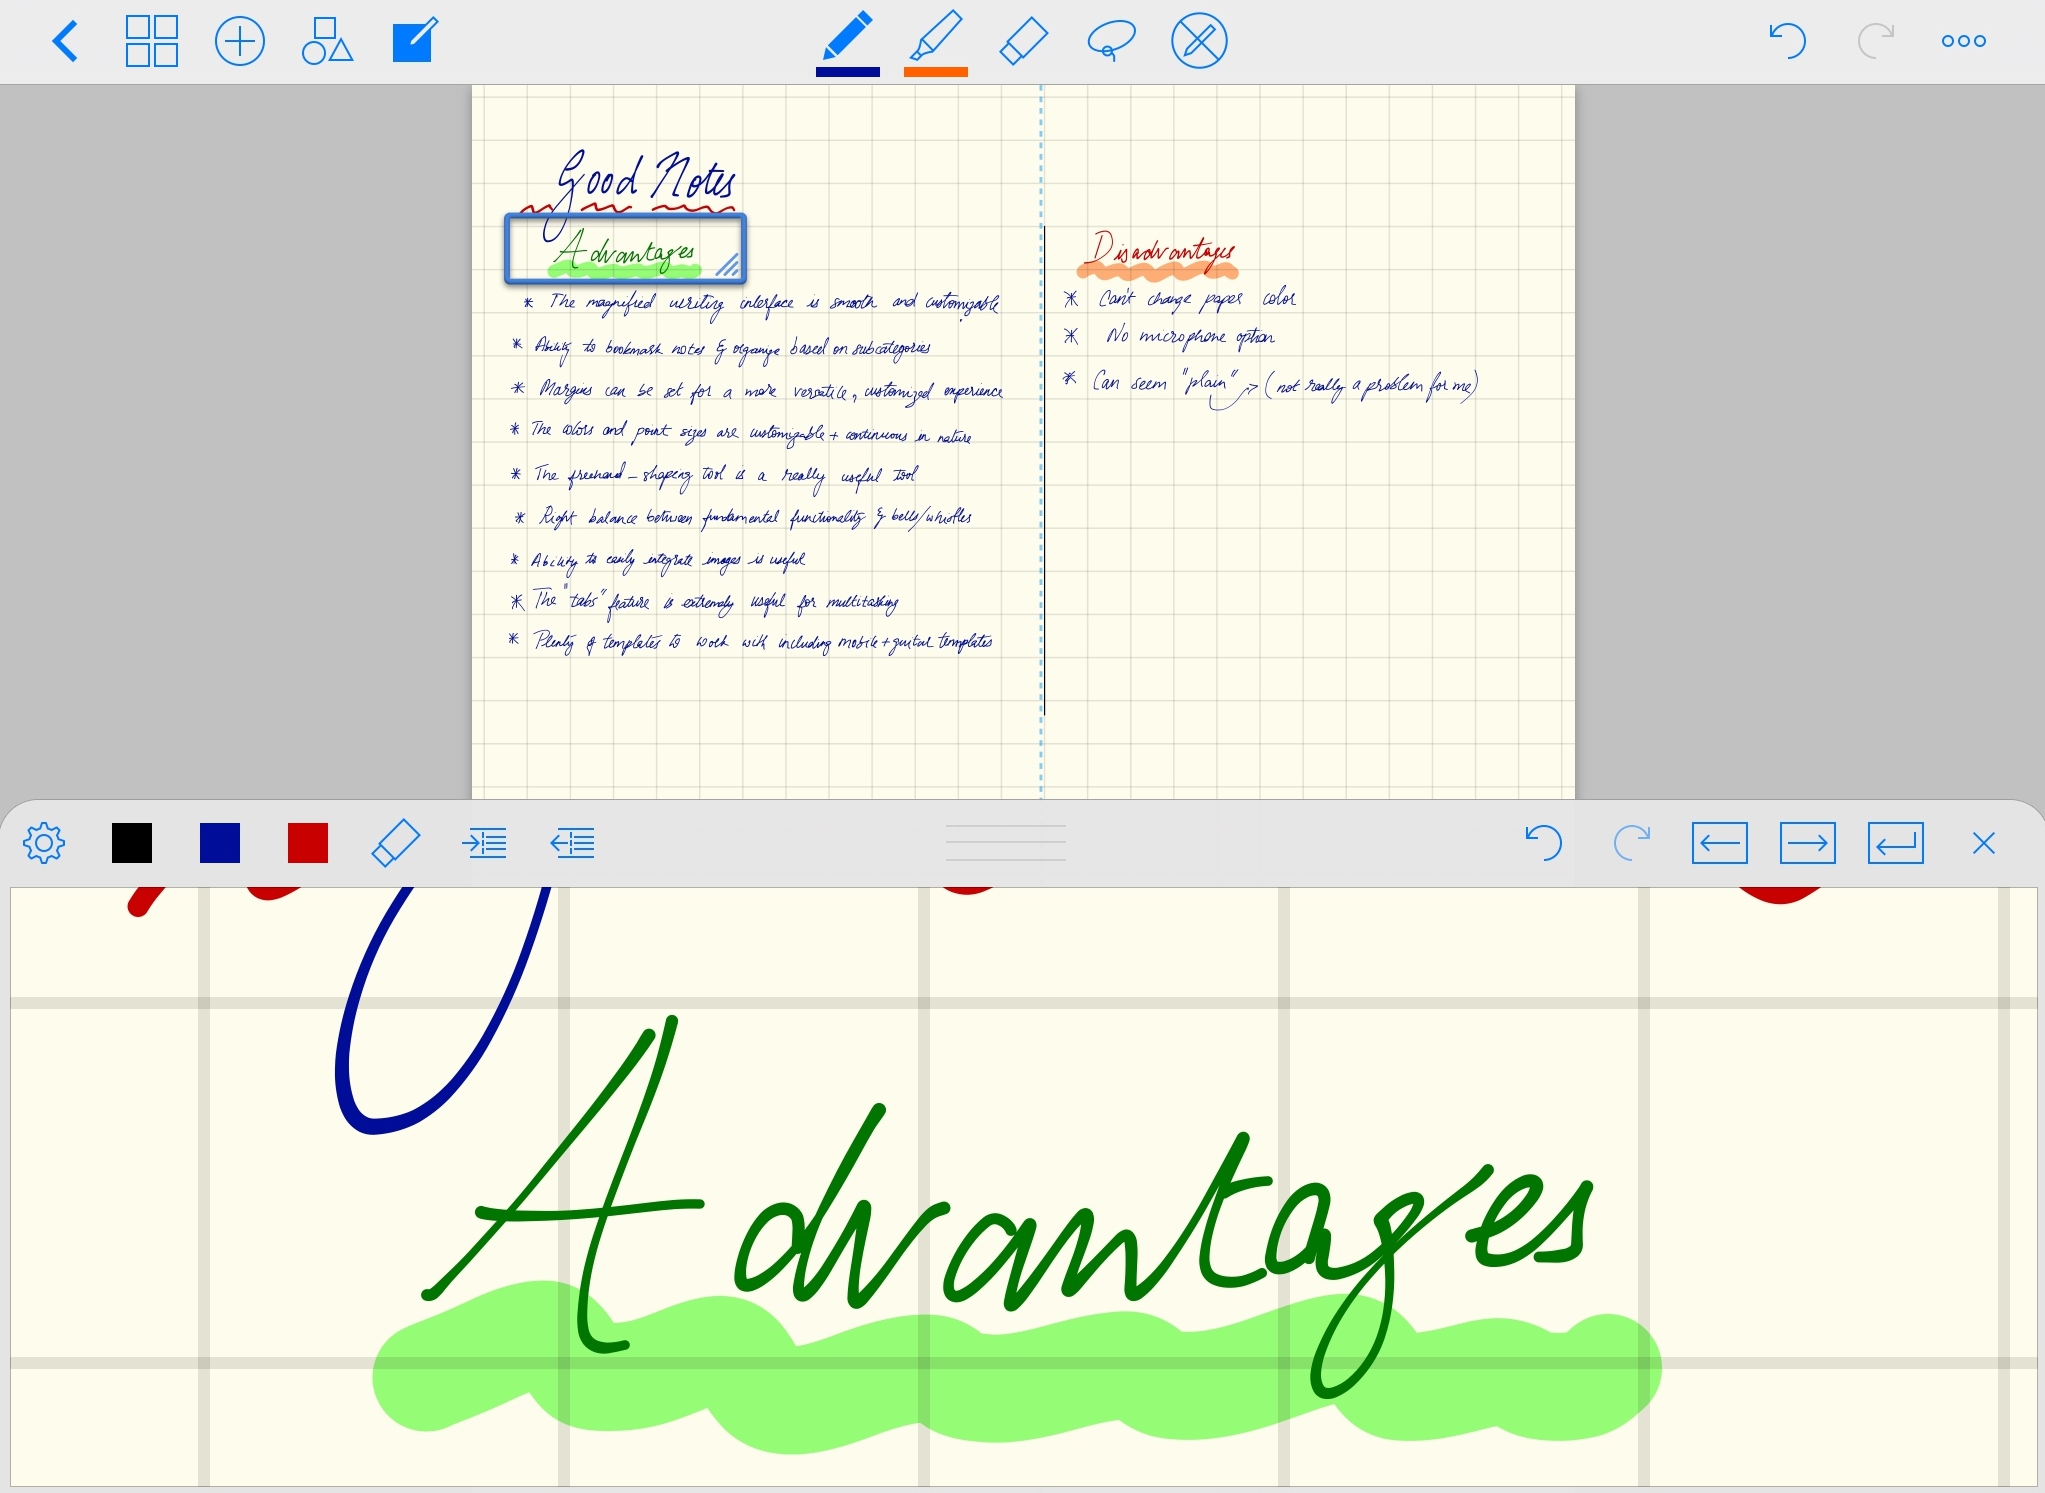
GoodNotes

An example screenshot from GoodNotes.

An example screenshot from GoodNotes.

Pros

  • OCR enabled! This gives quick access to a multitude of workflows and avenues for sharing (tweet on the fly etc.)
  • Magnification mode works seamless and ability to set different margins is very useful
  • The ability to bookmark and subcategorize 'notebook shelves' makes organization a breeze
  • Colors and point sizes are highly customizable
  • The freehand tool that produces automatic shapes (lines/circles etc.) is really useful
  • Multi-tab feature is highly effective for multitasking
  • Plenty of templates including mobile+guitar templates
  • Integrating media (PDFs/images) into the app is intuitive and effective

Cons

  • No microphone recording feature
  • Background paper color is fixed
  • Doesn't have as many bells and whistles as the others, making for a rather "plain" interface (although, this isn't really a problem for me)

Verdict: GoodNotes emerges as an easy winner for my needs. The balance between customization, features, and utility makes it simply "work" when needed and this is a huge plus for me. The magnification mode on GoodNotes proved to be the smoothest interface (with customizable margins) and sometimes you forget that you are (in the future!) and writing on a glass tablet. The lack of a recording option is unfortunate but honestly, even while I was on Notability, it was not something that I used frequently. Over the last few weeks, I have written several notes using GoodNotes and its organizational structure along with Evernote workflows caters to all my note-taking requirements.


TL;DR Verdict:

  • If you are picky about organizing your notes and want a great interface that simply "works",  GoodNotes is a fantastic bet.
  • If recording audio while taking down notes is something that appeals to you (can be useful to students in classrooms), go with Notability.
  • If you want to stick with a free app and get the ball rolling with handwriting apps, Penultimate is a solid option.