Paleowave

  • About
  • Blog
  • Search
Melted asphalt on Indian roads during May, 2015 [Source]

Melted asphalt on Indian roads during May, 2015 [Source]

India's Heat Wave

June 18, 2015 by Kaustubh Thirumalai in Technical Science, Popular Science

Last month, India faced what is purported to be the 5th deadliest heat wave on record for the planet, killing more than 2,300 people! Studies have shown that heat waves and temperature extremes in general will be exacerbated by global warming (see here, here, and here for example). Thus, it would be prudent to anticipate how bad these heat waves will get in the future.

This year is predicted to be a strong El Niño year, comparable to the juggernaut 1997-98 event, when India had its deadliest heat wave till date during May-June 1998. As during the '97-98 Niño event, most of the worst-hit areas were in the southeastern states of Andhra Pradesh and Telangana. Here, as well as throughout most parts of India, May is the hottest month of the year and is hence most conducive for heat waves. However, unlike other parts of India where the southwest monsoons bring rain and respite with its onset during June, southeastern India gets most of its rainfall during the retreating monsoon season (typically during northern hemisphere winter). 

 
Rainfall in the southeastern parts of India mainly derive from the retreating monsoon, peaking during October, while temperatures peak during May, typically when heat waves occur. Thus, summer monsoon rains cannot be depended upon to always alleviat…

Rainfall in the southeastern parts of India mainly derive from the retreating monsoon, peaking during October, while temperatures peak during May, typically when heat waves occur. Thus, summer monsoon rains cannot be depended upon to always alleviate May heat waves in southeastern India.


In June '97, a full year before the devastating heat wave, the southeastern coast of India was already anomalously warm (see below). May-June '98 was when the full brunt of the heat wave hit. With this being the case, and 2015 being analogous to 1997 June (prior to the Niño), are we to expect a worse heat wave next year?

May-June 1998, during the '97-98 El Niño event, was the deadliest heat wave to hit India

May-June 1998, during the '97-98 El Niño event, was the deadliest heat wave to hit India

In any case, the annual temperature anomalies for the southeastern part of the Indian subcontinent do not look pretty:

Monthly anomalies (black) and annual anomalies (colors).

Monthly anomalies (black) and annual anomalies (colors).

Considering trends in individual months, we see that the summer months of May to August are all warming anomalously, thereby exacerbating already-warm daily temperatures:

The summer months of May-August all seem to be warming anomalously, and will exacerbate already-warm daily temperatures. 

The summer months of May-August all seem to be warming anomalously, and will exacerbate already-warm daily temperatures. 

Take-home message: The Indian heat wave we saw this May is certainly not the worst to come in the coming years. Action and measures to deal with the heat must be taken appropriately. I wouldn't be too surprised if next year brings a scorcher.

June 18, 2015 /Kaustubh Thirumalai
India, Indian Monsoon, Heat Wave, Indian Heat Wave, Climatology, Heat, El Nino, ENSO
Technical Science, Popular Science
2 Comments
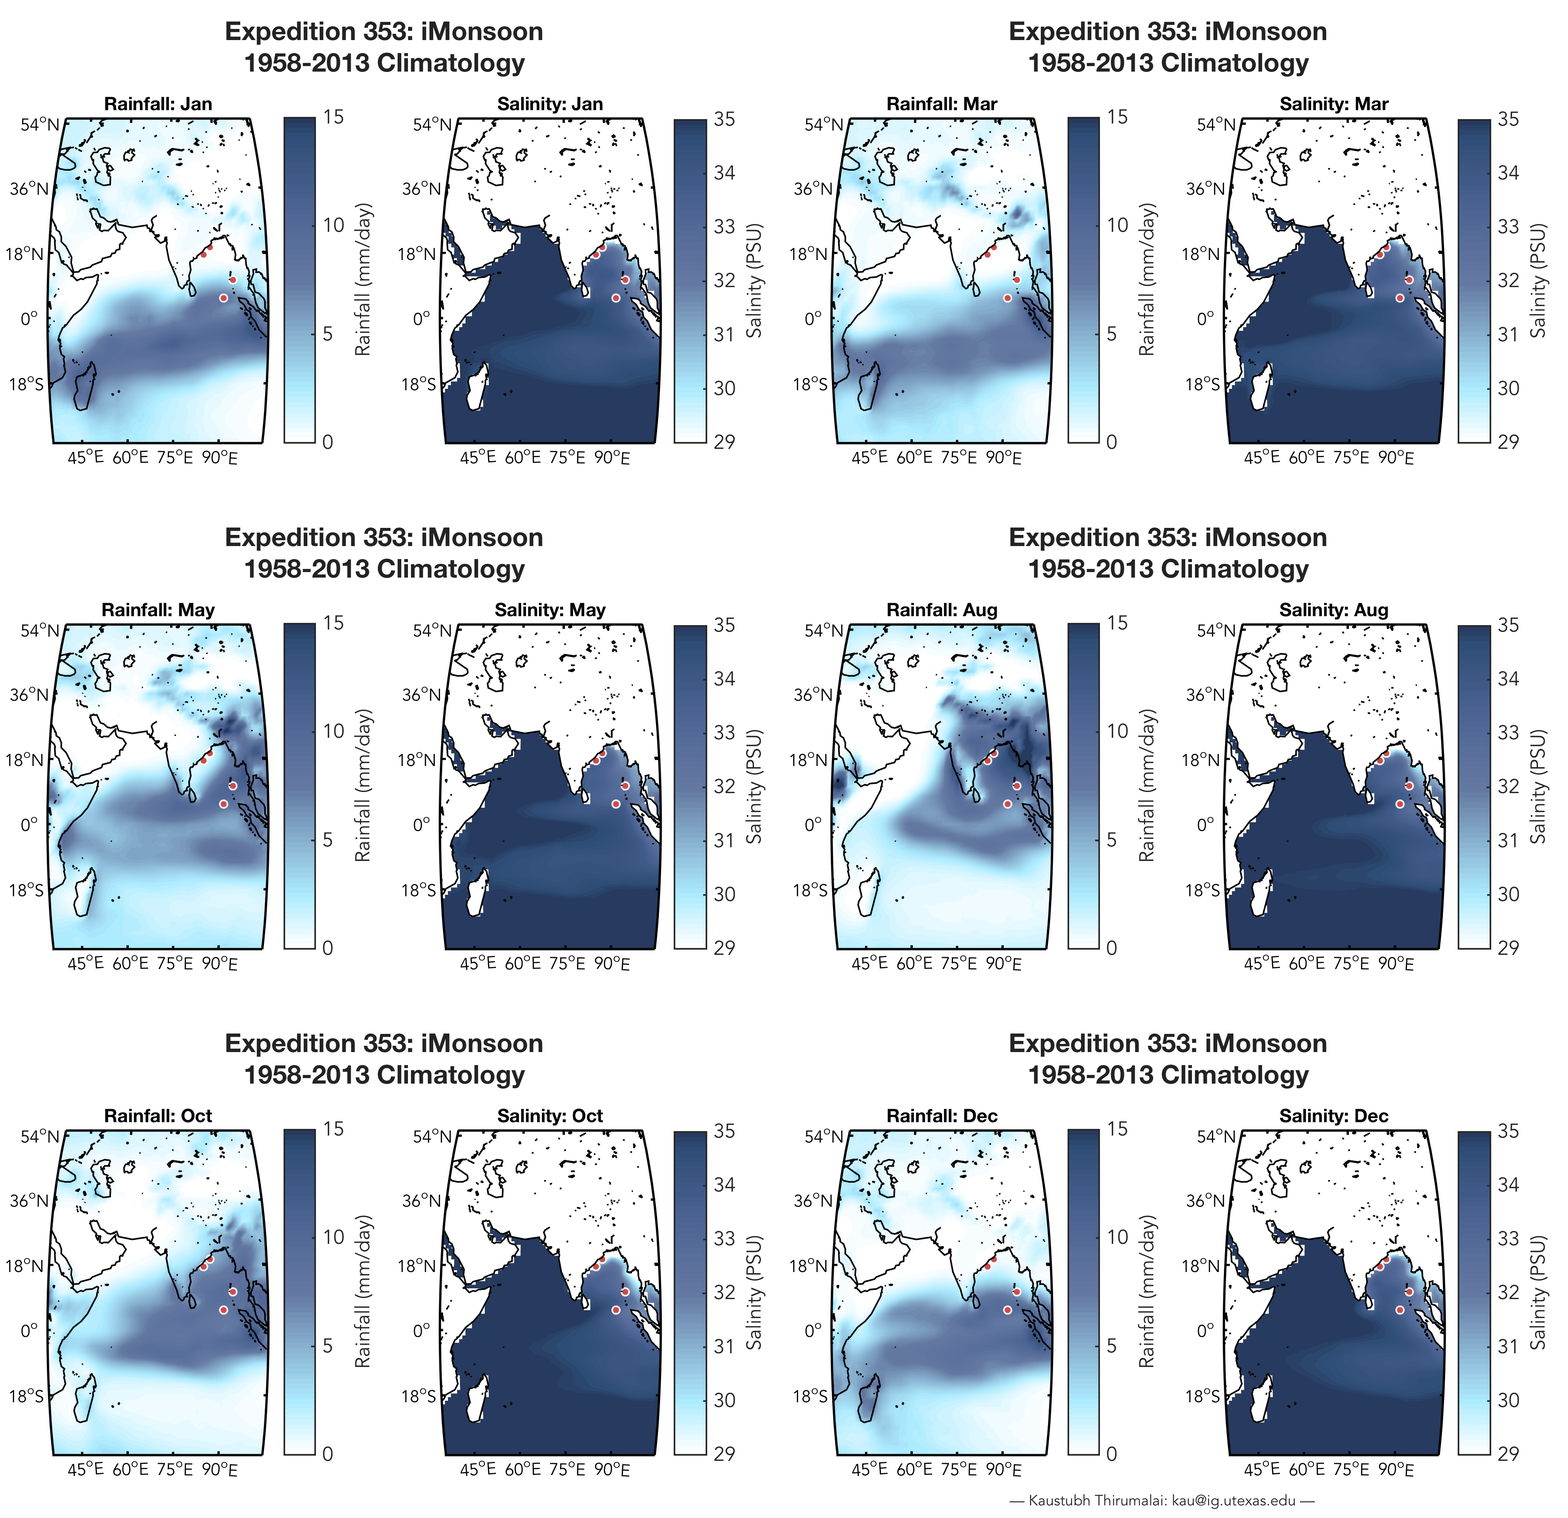
Monthly climatology of precipitation and sea-surface salinity over the Indian Ocean sector.

Monthly climatology of precipitation and sea-surface salinity over the Indian Ocean sector.

iMonsoon Climatology

January 09, 2015 by Kaustubh in Popular Science, Technical Science

Here is a gif (click here for full version) of rainfall over the Indian subcontinent and concurrent sea-surface salinity (SSS) in the Indian Ocean with the targeted sites for Expedition 353 (red circles). The precipitation data are in mm of rainfall per day and the SSS data are displayed in practical salinity units. Each frame displays average monthly data for 55 years from 1958-2013 (i.e. averaging all January data, all February data etc.) There are many things of interest that pop out for me in this animation. Some points of note:

  • The peak of monsoon rain over India is during the months of June, July, and August, or during Northern Hemisphere (boreal) summer.
  • There is a well formed band of rainfall over the southern Indian Ocean during boreal winter.
  • A freshwater pulse (< 30 PSU) close to the eastern coast of India can be observed a month or two after the JJA monsoon peak.
  • During the monsoon, the Bay of Bengal (along with the subcontinent) experiences abundant rainfall.
  • The Arabian Sea is much saltier than the Bay of Bengal.
  • All of the targeted expedition sites display heterogeneity in their seasonality.
  • Many Indian Ocean islands fall prey to poor coastal resolution data (oops!)

What pops out for you? Drop a line in the comments if you'd like details about the methodology.

January 09, 2015 /Kaustubh
Climate, Expedition 353, iMonsoon, Indian Monsoon, IODP, Rainfall, Salinity
Popular Science, Technical Science
1 Comment
353-sci-party-contact-sheet.jpg

iMonsoon

December 08, 2014 by Kaustubh in Popular Science

Ahoy! I am typing this blogpost aboard the JOIDES Resolution, the flagship of the International Ocean Discovery Program, in the middle of the Indian Ocean! Last night, we reached Ninetyeast Ridge (most-creatively named!), the first drilling site of our research expedition. Currently we are waiting for the drillers to make sure all the equipment is calibrated and ready-to-go. All of us on the day shift and a few from the night shift who are awake are excited and eager to see the first cores come up on deck.

The main goal of Expedition 353: Indian Monsoon Rainfall (or iMonsoon for short) is to understand how the Indian monsoon evolved over the last several tens of millions of years. How is this achieved? By retrieving land-based sediments that made their way to the seafloor through the numerous rivers that flow into Bay of Bengal and/or through wind-based transport. These sediments house the shells of oceanic critters that were living in the past (like foraminifera, diatoms, radiolarians etc.) One of the major factors that influences the chemistry of these sediments and the numerous fossils that are preserved in them is rainfall over the Indian Subcontinent.

So, these sediments hold the key to understanding past monsoon strength (or lack of it). The deeper we drill – the older the sediments. Why do we care about monsoons in the past? Well, we only have very brief instrumental measurements of how much it rained over India, perhaps, 100 years or so – a geological instant. The Indian monsoon has been around a lot longer than that and thus, to fully understand how the monsoon is capable of changing, we need to be really knowledgeable about its past.

The JOIDES Resolution is a very capable research vessel. There are 30 shipboard scientists aboard, each with a unique job assignment. In total, including the technical staff, drilling staff, and the crew, I think we are about ~100 people on the ship. The food is fantastic (lots of options), and the ship is equipped with a gym and movie room.

I am sailing as a sedimentologist on this expedition, which means I will be inspecting, characterizing, and describing all the cores that we collect. As I mentioned, we are eager to start seeing cores and getting a glimpse of what we will be working for the coming few years! I will try and update this spot periodically with our progress. Wish us luck!

December 08, 2014 /Kaustubh
iMonsoon, Indian Monsoon, IODP, JOIDES Resolution, Paleoceanography, Paleomonsoon
Popular Science
Comment